


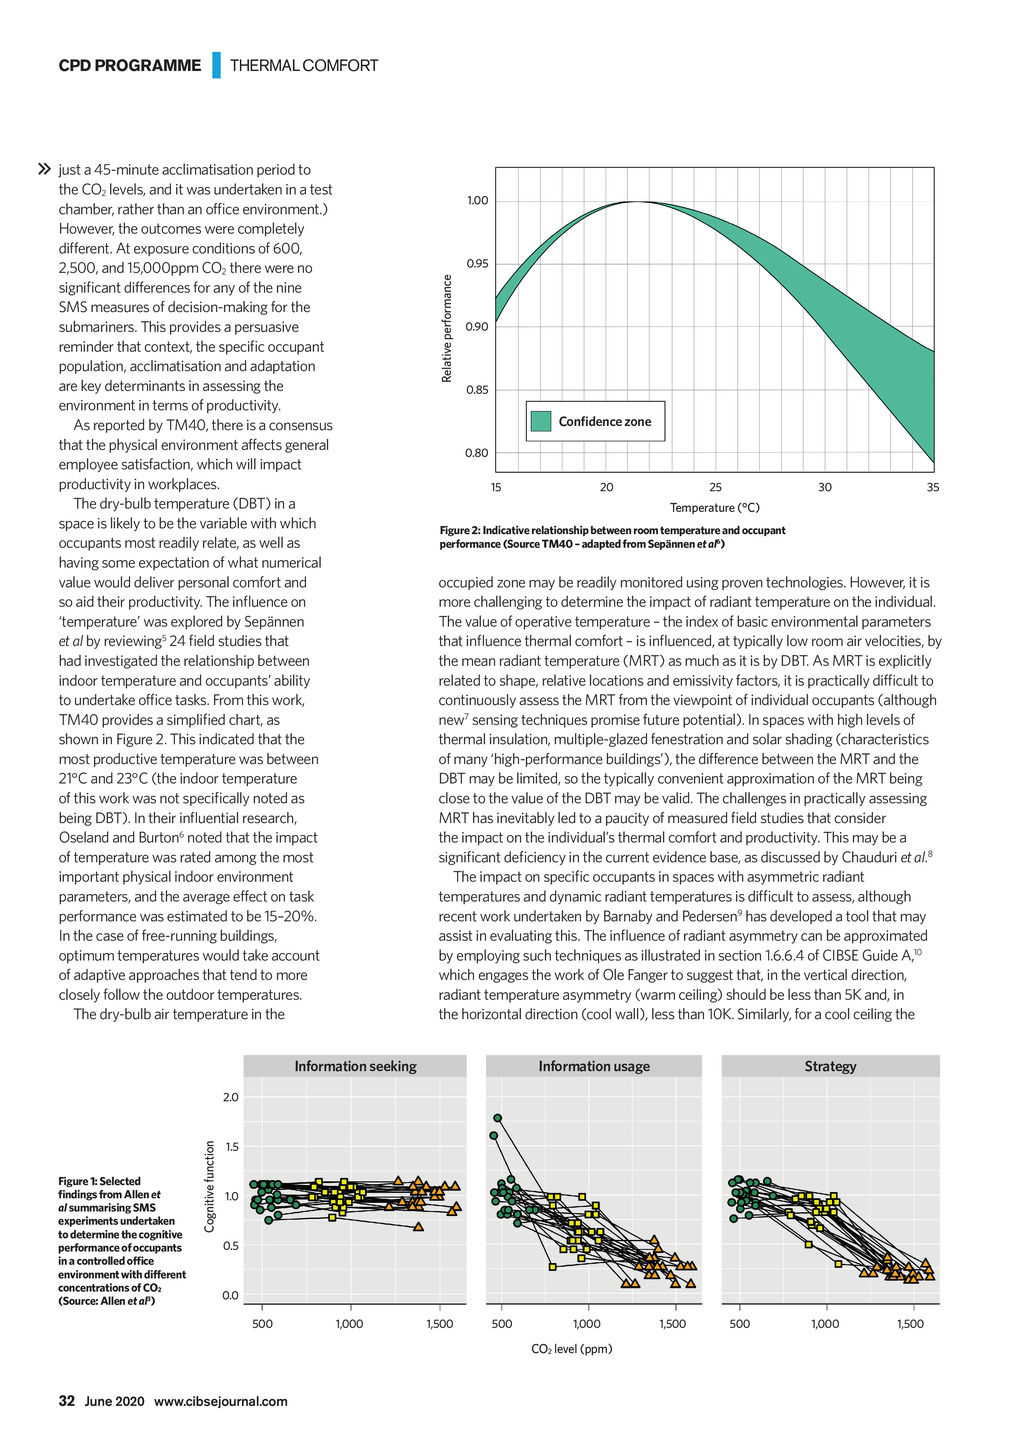

CPD PROGRAMME | THERMAL COMFORT just a 45-minute acclimatisation period to the CO2 levels, and it was undertaken in a test chamber, rather than an office environment.) However, the outcomes were completely different. At exposure conditions of 600, 2,500, and 15,000ppm CO2 there were no significant differences for any of the nine SMS measures of decision-making for the submariners. This provides a persuasive reminder that context, the specific occupant population, acclimatisation and adaptation are key determinants in assessing the environment in terms of productivity. As reported by TM40, there is a consensus that the physical environment affects general employee satisfaction, which will impact productivity in workplaces. The dry-bulb temperature (DBT) in a space is likely to be the variable with which occupants most readily relate, as well as having some expectation of what numerical value would deliver personal comfort and so aid their productivity. The influence on temperature was explored by Sepnnen et al by reviewing5 24 field studies that had investigated the relationship between indoor temperature and occupants ability to undertake office tasks. From this work, TM40 provides a simplified chart, as shown in Figure 2. This indicated that the most productive temperature was between 21C and 23C (the indoor temperature of this work was not specifically noted as being DBT). In their influential research, Oseland and Burton6 noted that the impact of temperature was rated among the most important physical indoor environment parameters, and the average effect on task performance was estimated to be 1520%. In the case of free-running buildings, optimum temperatures would take account of adaptive approaches that tend to more closely follow the outdoor temperatures. The dry-bulb air temperature in the 1.00 Relative performance 0.95 0.90 0.85 Confidence zone 0.80 15 20 25 30 35 Temperature (C) Figure 2: Indicative relationship between room temperature and occupant performance (Source TM40 adapted from Sepnnen et al6) occupied zone may be readily monitored using proven technologies. However, it is more challenging to determine the impact of radiant temperature on the individual. The value of operative temperature the index of basic environmental parameters that influence thermal comfort is influenced, at typically low room air velocities, by the mean radiant temperature (MRT) as much as it is by DBT. As MRT is explicitly related to shape, relative locations and emissivity factors, it is practically difficult to continuously assess the MRT from the viewpoint of individual occupants (although new7 sensing techniques promise future potential). In spaces with high levels of thermal insulation, multiple-glazed fenestration and solar shading (characteristics of many high-performance buildings), the difference between the MRT and the DBT may be limited, so the typically convenient approximation of the MRT being close to the value of the DBT may be valid. The challenges in practically assessing MRT has inevitably led to a paucity of measured field studies that consider the impact on the individuals thermal comfort and productivity. This may be a significant deficiency in the current evidence base, as discussed by Chauduri et al.8 The impact on specific occupants in spaces with asymmetric radiant temperatures and dynamic radiant temperatures is difficult to assess, although recent work undertaken by Barnaby and Pedersen9 has developed a tool that may assist in evaluating this. The influence of radiant asymmetry can be approximated by employing such techniques as illustrated in section 1.6.6.4 of CIBSE Guide A,10 which engages the work of Ole Fanger to suggest that, in the vertical direction, radiant temperature asymmetry (warm ceiling) should be less than 5K and, in the horizontal direction (cool wall), less than 10K. Similarly, for a cool ceiling the Information seeking Information usage Strategy Figure 1: Selected findings from Allen et al summarising SMS experiments undertaken to determine the cognitive performance of occupants in a controlled office environment with different concentrations of CO2 (Source: Allen et al3) Cognitive function 2.0 1.5 1.0 0.5 0.0 500 1,000 1,500 500 1,000 1,500 500 1,000 1,500 CO2 level (ppm) 32 June 2020 www.cibsejournal.com CIBSE June 2020 p31-34 Supp Swegon164 v2.indd 32 22/05/2020 17:38