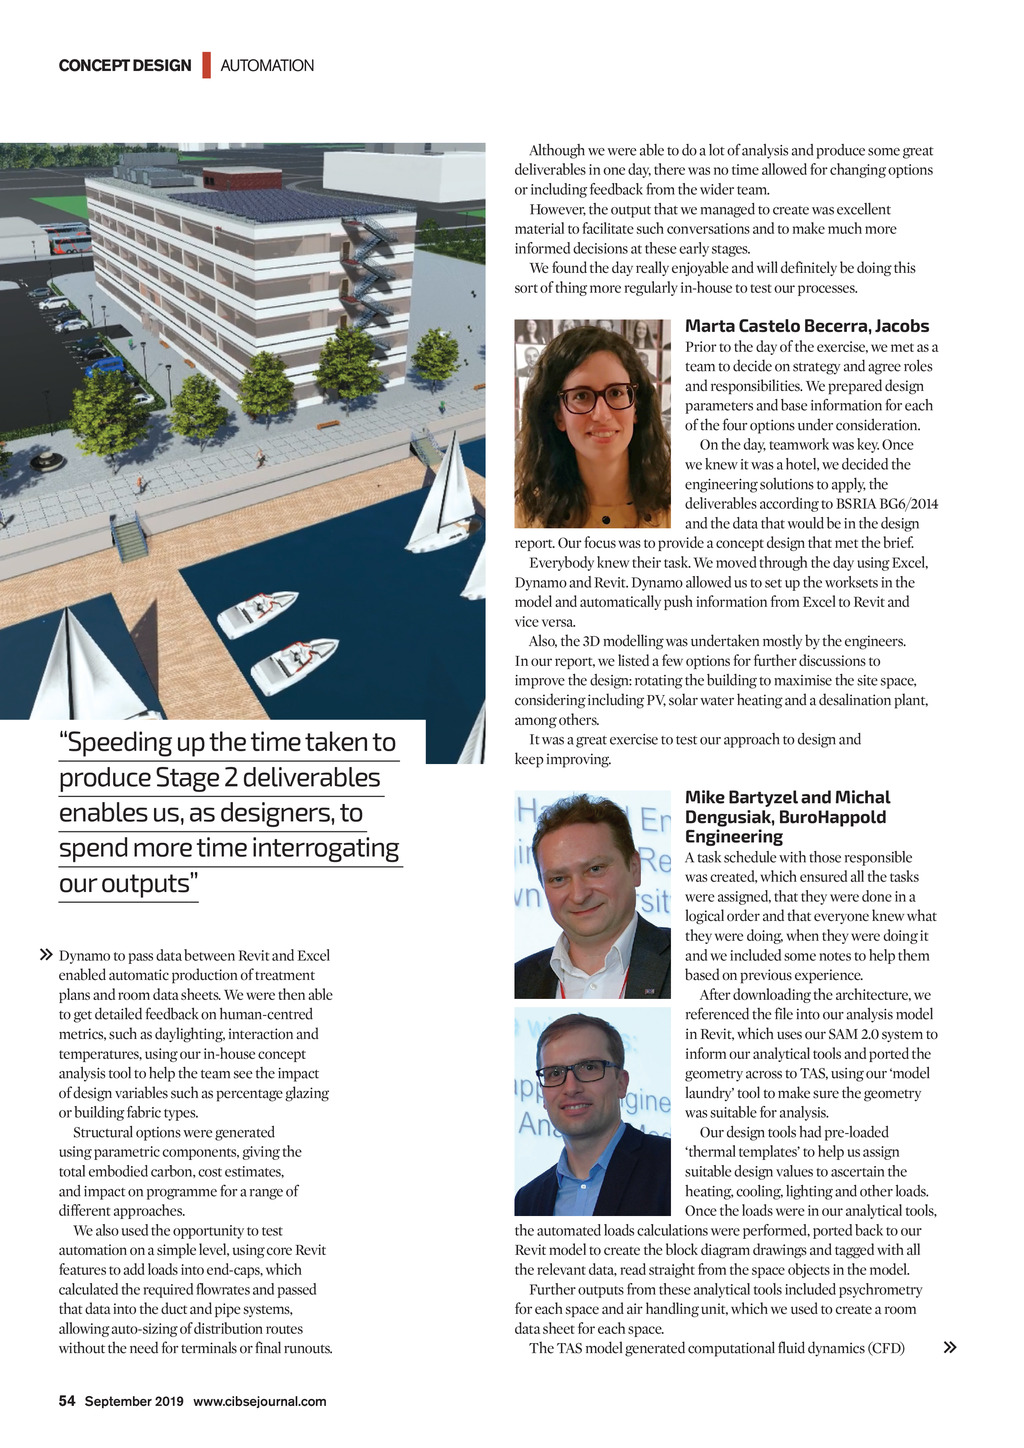


CONCEPT DESIGN | AUTOMATION Although we were able to do a lot of analysis and produce some great deliverables in one day, there was no time allowed for changing options or including feedback from the wider team. However, the output that we managed to create was excellent material to facilitate such conversations and to make much more informed decisions at these early stages. We found the day really enjoyable and will definitely be doing this sort of thing more regularly in-house to test our processes. Marta Castelo Becerra, Jacobs Speeding up the time taken to produce Stage 2 deliverables enables us, as designers, to spend more time interrogating our outputs Dynamo to pass data between Revit and Excel enabled automatic production of treatment plans and room data sheets. We were then able to get detailed feedback on human-centred metrics, such as daylighting, interaction and temperatures, using our in-house concept analysis tool to help the team see the impact of design variables such as percentage glazing or building fabric types. Structural options were generated using parametric components, giving the total embodied carbon, cost estimates, and impact on programme for a range of different approaches. We also used the opportunity to test automation on a simple level, using core Revit features to add loads into end-caps, which calculated the required flowrates and passed that data into the duct and pipe systems, allowing auto-sizing of distribution routes without the need for terminals or final runouts. Prior to the day of the exercise, we met as a team to decide on strategy and agree roles and responsibilities. We prepared design parameters and base information for each of the four options under consideration. On the day, teamwork was key. Once we knew it was a hotel, we decided the engineering solutions to apply, the deliverables according to BSRIA BG6/2014 and the data that would be in the design report. Our focus was to provide a concept design that met the brief. Everybody knew their task. We moved through the day using Excel, Dynamo and Revit. Dynamo allowed us to set up the worksets in the model and automatically push information from Excel to Revit and vice versa. Also, the 3D modelling was undertaken mostly by the engineers. In our report, we listed a few options for further discussions to improve the design: rotating the building to maximise the site space, considering including PV, solar water heating and a desalination plant, among others. It was a great exercise to test our approach to design and keep improving. Mike Bartyzel and Michal Dengusiak, BuroHappold Engineering A task schedule with those responsible was created, which ensured all the tasks were assigned, that they were done in a logical order and that everyone knew what they were doing, when they were doing it and we included some notes to help them based on previous experience. After downloading the architecture, we referenced the file into our analysis model in Revit, which uses our SAM 2.0 system to inform our analytical tools and ported the geometry across to TAS, using our model laundry tool to make sure the geometry was suitable for analysis. Our design tools had pre-loaded thermal templates to help us assign suitable design values to ascertain the heating, cooling, lighting and other loads. Once the loads were in our analytical tools, the automated loads calculations were performed, ported back to our Revit model to create the block diagram drawings and tagged with all the relevant data, read straight from the space objects in the model. Further outputs from these analytical tools included psychrometry for each space and air handling unit, which we used to create a room data sheet for each space. The TAS model generated computational fluid dynamics (CFD) 54 September 2019 www.cibsejournal.com CIBSE Sep19 pp53-54, 56 Concept design.indd 54 23/08/2019 16:52