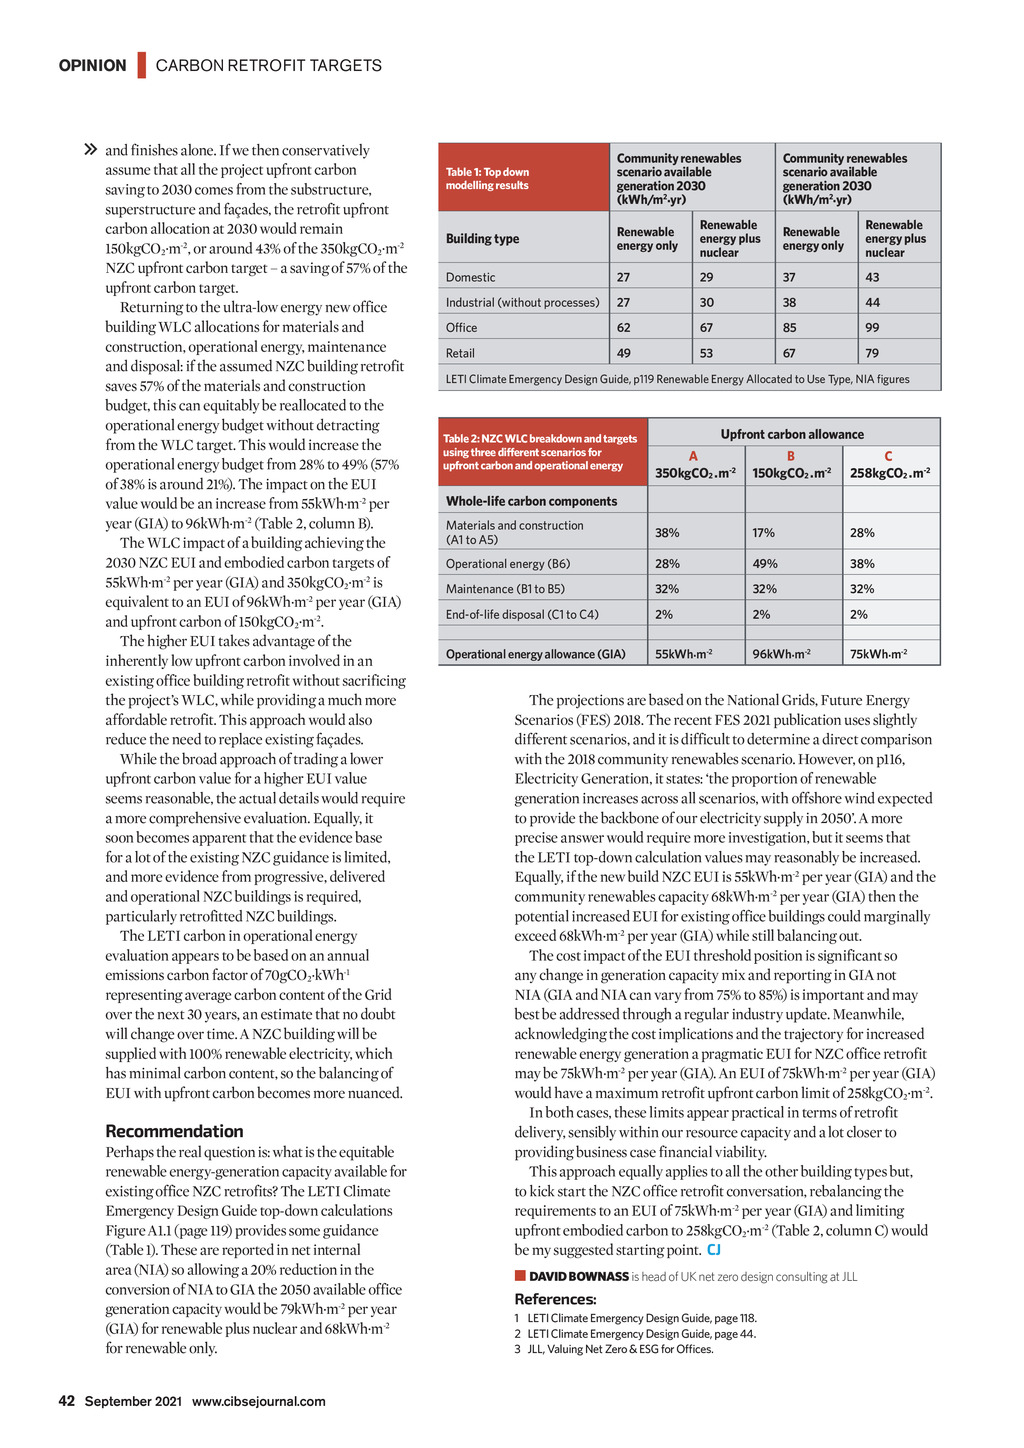


OPINION | CARBON RETROFIT TARGETS and finishes alone. If we then conservatively assume that all the project upfront carbon saving to 2030 comes from the substructure, superstructure and faades, the retrofit upfront carbon allocation at 2030 would remain 150kgCO2.m-2, or around 43% of the 350kgCO2.m-2 NZC upfront carbon target a saving of 57% of the upfront carbon target. Returning to the ultra-low energy new office building WLC allocations for materials and construction, operational energy, maintenance and disposal: if the assumed NZC building retrofit saves 57% of the materials and construction budget, this can equitably be reallocated to the operational energy budget without detracting from the WLC target. This would increase the operational energy budget from 28% to 49% (57% of 38% is around 21%). The impact on the EUI value would be an increase from 55kWh.m-2 per year (GIA) to 96kWh.m-2 (Table 2, column B). The WLC impact of a building achieving the 2030 NZC EUI and embodied carbon targets of 55kWh.m-2 per year (GIA) and 350kgCO2.m-2 is equivalent to an EUI of 96kWh.m-2 per year (GIA) and upfront carbon of 150kgCO2.m-2. The higher EUI takes advantage of the inherently low upfront carbon involved in an existing office building retrofit without sacrificing the projects WLC, while providing a much more affordable retrofit. This approach would also reduce the need to replace existing faades. While the broad approach of trading a lower upfront carbon value for a higher EUI value seems reasonable, the actual details would require a more comprehensive evaluation. Equally, it soon becomes apparent that the evidence base for a lot of the existing NZC guidance is limited, and more evidence from progressive, delivered and operational NZC buildings is required, particularly retrofitted NZC buildings. The LETI carbon in operational energy evaluation appears to be based on an annual emissions carbon factor of 70gCO2.kWh-1 representing average carbon content of the Grid over the next 30 years, an estimate that no doubt will change over time. A NZC building will be supplied with 100% renewable electricity, which has minimal carbon content, so the balancing of EUI with upfront carbon becomes more nuanced. Recommendation Perhaps the real question is: what is the equitable renewable energy-generation capacity available for existing office NZC retrofits? The LETI Climate Emergency Design Guide top-down calculations Figure A1.1 (page 119) provides some guidance (Table 1). These are reported in net internal area (NIA) so allowing a 20% reduction in the conversion of NIA to GIA the 2050 available office generation capacity would be 79kWh.m-2 per year (GIA) for renewable plus nuclear and 68kWh.m-2 for renewable only. Community renewables scenario available generation 2030 (kWh/m2.yr) Table 1: Top down modelling results Community renewables scenario available generation 2030 (kWh/m2.yr) Building type Renewable energy only Renewable energy plus nuclear Renewable energy only Renewable energy plus nuclear Domestic 27 29 37 43 Industrial (without processes) 27 30 38 44 62 67 85 99 49 53 67 79 Retail Table 2: NZC WLC breakdown and targets using three different scenarios for upfront carbon and operational energy Upfront carbon allowance A 350kgCO2 .m-2 B 150kgCO2 .m-2 C 258kgCO2 .m-2 Materials and construction (A1 to A5) 38% 17% 28% Operational energy (B6) 28% 49% 38% Maintenance (B1 to B5) 32% 32% 32% End-of-life disposal (C1 to C4) 2% 2% 2% Operational energy allowance (GIA) 55kWh.m-2 96kWh.m-2 75kWh.m-2 Whole-life carbon components The projections are based on the National Grids, Future Energy Scenarios (FES) 2018. The recent FES 2021 publication uses slightly different scenarios, and it is difficult to determine a direct comparison with the 2018 community renewables scenario. However, on p116, Electricity Generation, it states: the proportion of renewable generation increases across all scenarios, with offshore wind expected to provide the backbone of our electricity supply in 2050. A more precise answer would require more investigation, but it seems that the LETI top-down calculation values may reasonably be increased. Equally, if the new build NZC EUI is 55kWh.m-2 per year (GIA) and the community renewables capacity 68kWh.m-2 per year (GIA) then the potential increased EUI for existing office buildings could marginally exceed 68kWh.m-2 per year (GIA) while still balancing out. The cost impact of the EUI threshold position is significant so any change in generation capacity mix and reporting in GIA not NIA (GIA and NIA can vary from 75% to 85%) is important and may best be addressed through a regular industry update. Meanwhile, acknowledging the cost implications and the trajectory for increased renewable energy generation a pragmatic EUI for NZC office retrofit may be 75kWh.m-2 per year (GIA). An EUI of 75kWh.m-2 per year (GIA) would have a maximum retrofit upfront carbon limit of 258kgCO2.m-2. In both cases, these limits appear practical in terms of retrofit delivery, sensibly within our resource capacity and a lot closer to providing business case financial viability. This approach equally applies to all the other building types but, to kick start the NZC office retrofit conversation, rebalancing the requirements to an EUI of 75kWh.m-2 per year (GIA) and limiting upfront embodied carbon to 258kgCO2.m-2 (Table 2, column C) would be my suggested starting point. CJ DAVID BOWNASS is head of UK net zero design consulting at JLL References: 1 LETI Climate Emergency Design Guide, page 118. 2 LETI Climate Emergency Design Guide, page 44. 42 September 2021 www.cibsejournal.com CIBSE Sep 21 pp40-42 Net zero JLL.indd 42 27/08/2021 16:17