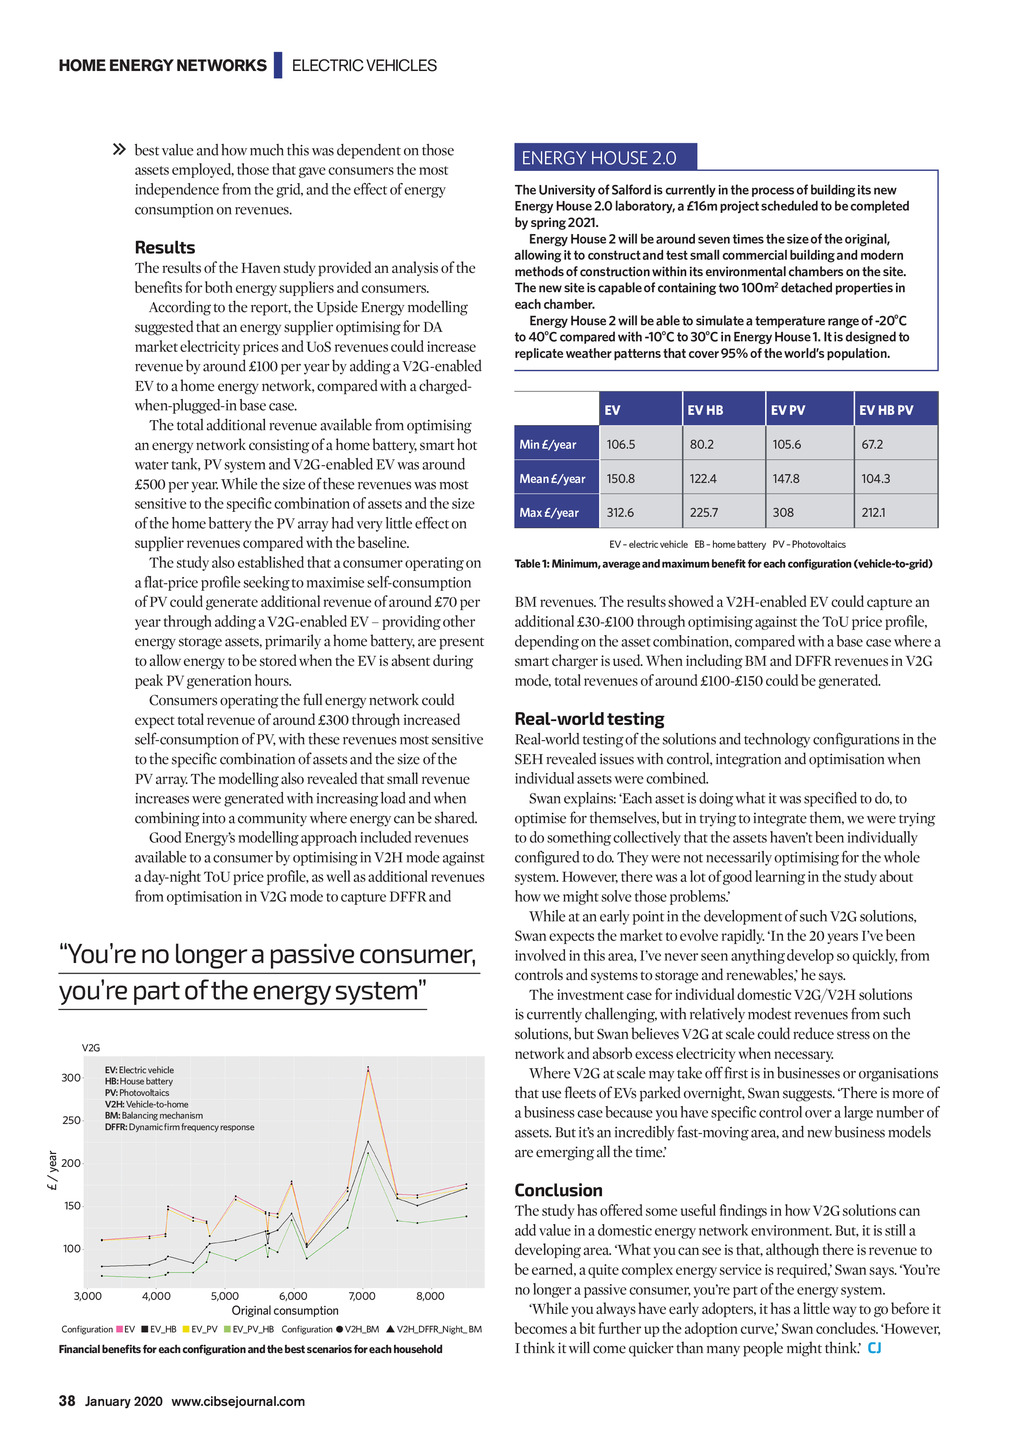


HOME ENERGY NETWORKS | ELECTRIC VEHICLES best value and how much this was dependent on those assets employed, those that gave consumers the most independence from the grid, and the effect of energy consumption on revenues. Results The results of the Haven study provided an analysis of the benefits for both energy suppliers and consumers. According to the report, the Upside Energy modelling suggested that an energy supplier optimising for DA market electricity prices and UoS revenues could increase revenue by around 100 per year by adding a V2G-enabled EV to a home energy network, compared with a chargedwhen-plugged-in base case. The total additional revenue available from optimising an energy network consisting of a home battery, smart hot water tank, PV system and V2G-enabled EV was around 500 per year. While the size of these revenues was most sensitive to the specific combination of assets and the size of the home battery the PV array had very little effect on supplier revenues compared with the baseline. The study also established that a consumer operating on a flat-price profile seeking to maximise self-consumption of PV could generate additional revenue of around 70 per year through adding a V2G-enabled EV providing other energy storage assets, primarily a home battery, are present to allow energy to be stored when the EV is absent during peak PV generation hours. Consumers operating the full energy network could expect total revenue of around 300 through increased self-consumption of PV, with these revenues most sensitive to the specific combination of assets and the size of the PV array. The modelling also revealed that small revenue increases were generated with increasing load and when combining into a community where energy can be shared. Good Energys modelling approach included revenues available to a consumer by optimising in V2H mode against a day-night ToU price profile, as well as additional revenues from optimisation in V2G mode to capture DFFR and Youre no longer a passive consumer, youre part of the energy system V2G 300 / year 250 EV: Electric vehicle HB: House battery PV: Photovoltaics V2H: Vehicle-to-home BM: Balancing mechanism DFFR: Dynamic firm frequency response 200 The University of Salford is currently in the process of building its new Energy House 2.0 laboratory, a 16m project scheduled to be completed by spring 2021. Energy House 2 will be around seven times the size of the original, allowing it to construct and test small commercial building and modern methods of construction within its environmental chambers on the site. The new site is capable of containing two 100m2 detached properties in each chamber. Energy House 2 will be able to simulate a temperature range of -20oC to 40oC compared with -10oC to 30oC in Energy House 1. It is designed to replicate weather patterns that cover 95% of the worlds population. EV EV HB EV PV EV HB PV Min /year 106.5 80.2 105.6 67.2 Mean /year 150.8 122.4 147.8 104.3 Max /year 312.6 225.7 308 212.1 EV electric vehicle EB home battery PV Photovoltaics Table 1: Minimum, average and maximum benefit for each configuration (vehicle-to-grid) BM revenues. The results showed a V2H-enabled EV could capture an additional 30-100 through optimising against the ToU price profile, depending on the asset combination, compared with a base case where a smart charger is used. When including BM and DFFR revenues in V2G mode, total revenues of around 100-150 could be generated. Real-world testing Real-world testing of the solutions and technology configurations in the SEH revealed issues with control, integration and optimisation when individual assets were combined. Swan explains: Each asset is doing what it was specified to do, to optimise for themselves, but in trying to integrate them, we were trying to do something collectively that the assets havent been individually configured to do. They were not necessarily optimising for the whole system. However, there was a lot of good learning in the study about how we might solve those problems. While at an early point in the development of such V2G solutions, Swan expects the market to evolve rapidly. In the 20 years Ive been involved in this area, Ive never seen anything develop so quickly, from controls and systems to storage and renewables, he says. The investment case for individual domestic V2G/V2H solutions is currently challenging, with relatively modest revenues from such solutions, but Swan believes V2G at scale could reduce stress on the network and absorb excess electricity when necessary. Where V2G at scale may take off first is in businesses or organisations that use fleets of EVs parked overnight, Swan suggests. There is more of a business case because you have specific control over a large number of assets. But its an incredibly fast-moving area, and new business models are emerging all the time. Conclusion 150 100 3,000 ENERGY HOUSE 2.0 4,000 5,000 6,000 7,000 8,000 Original consumption Configuration EV EV_HB EV_PV EV_PV_HB Configuration V2H_BM V2H_DFFR_Night_ BM Financial benefits for each configuration and the best scenarios for each household The study has offered some useful findings in how V2G solutions can add value in a domestic energy network environment. But, it is still a developing area. What you can see is that, although there is revenue to be earned, a quite complex energy service is required, Swan says. Youre no longer a passive consumer, youre part of the energy system. While you always have early adopters, it has a little way to go before it becomes a bit further up the adoption curve, Swan concludes. However, I think it will come quicker than many people might think. CJ 38 January 2020 www.cibsejournal.com CIBSE Jan20 pp36-38 Electric vehicle.indd 38 20/12/2019 15:28