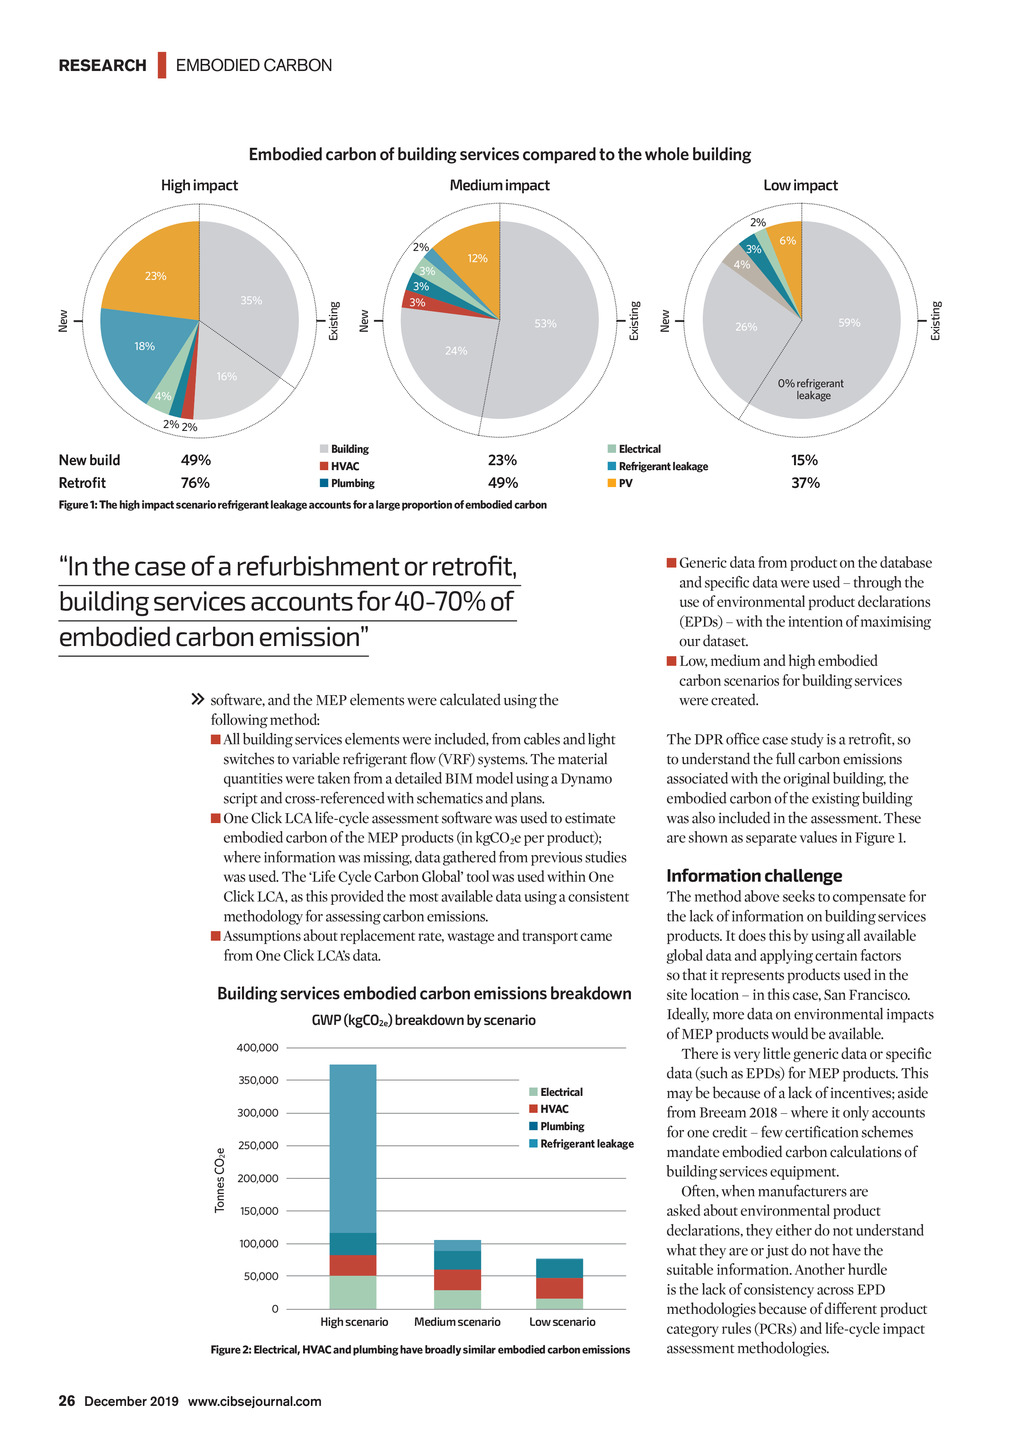


RESEARCH | EMBODIED CARBON Embodied carbon of building services compared to the whole building High impact Medium impact Low impact 2% 18% 53% New New New Existing 35% Existing 3% 3% 3% 23% 3% 4% 12% 6% 59% 26% Existing 2% 24% 16% 0% refrigerant leakage 4% 2% 2% New build Retrofit Building HVAC Plumbing 49% 76% Electrical Refrigerant leakage PV 23% 49% 15% 37% Figure 1: The high impact scenario refrigerant leakage accounts for a large proportion of embodied carbon In the case of a refurbishment or retrofit, building services accounts for 40-70% of embodied carbon emission Generic data from product on the database software, and the MEP elements were calculated using the following method: All building services elements were included, from cables and light switches to variable refrigerant flow (VRF) systems. The material quantities were taken from a detailed BIM model using a Dynamo script and cross-referenced with schematics and plans. One Click LCA life-cycle assessment software was used to estimate embodied carbon of the MEP products (in kgCO2e per product); where information was missing, data gathered from previous studies was used. The Life Cycle Carbon Global tool was used within One Click LCA, as this provided the most available data using a consistent methodology for assessing carbon emissions. Assumptions about replacement rate, wastage and transport came from One Click LCAs data. Building services embodied carbon emissions breakdown GWP (kgCO2e) breakdown by scenario 400,000 350,000 Electrical HVAC Plumbing Refrigerant leakage Tonnes CO2e 300,000 250,000 200,000 150,000 100,000 50,000 0 High scenario Medium scenario Low scenario Figure 2: Electrical, HVAC and plumbing have broadly similar embodied carbon emissions and specific data were used through the use of environmental product declarations (EPDs) with the intention of maximising our dataset. Low, medium and high embodied carbon scenarios for building services were created. The DPR office case study is a retrofit, so to understand the full carbon emissions associated with the original building, the embodied carbon of the existing building was also included in the assessment. These are shown as separate values in Figure 1. Information challenge The method above seeks to compensate for the lack of information on building services products. It does this by using all available global data and applying certain factors so that it represents products used in the site location in this case, San Francisco. Ideally, more data on environmental impacts of MEP products would be available. There is very little generic data or specific data (such as EPDs) for MEP products. This may be because of a lack of incentives; aside from Breeam 2018 where it only accounts for one credit few certification schemes mandate embodied carbon calculations of building services equipment. Often, when manufacturers are asked about environmental product declarations, they either do not understand what they are or just do not have the suitable information. Another hurdle is the lack of consistency across EPD methodologies because of different product category rules (PCRs) and life-cycle impact assessment methodologies. 26 December 2019 www.cibsejournal.com CIBSE Dec19 pp25-27 Embodied carbon.indd 26 22/11/2019 16:58