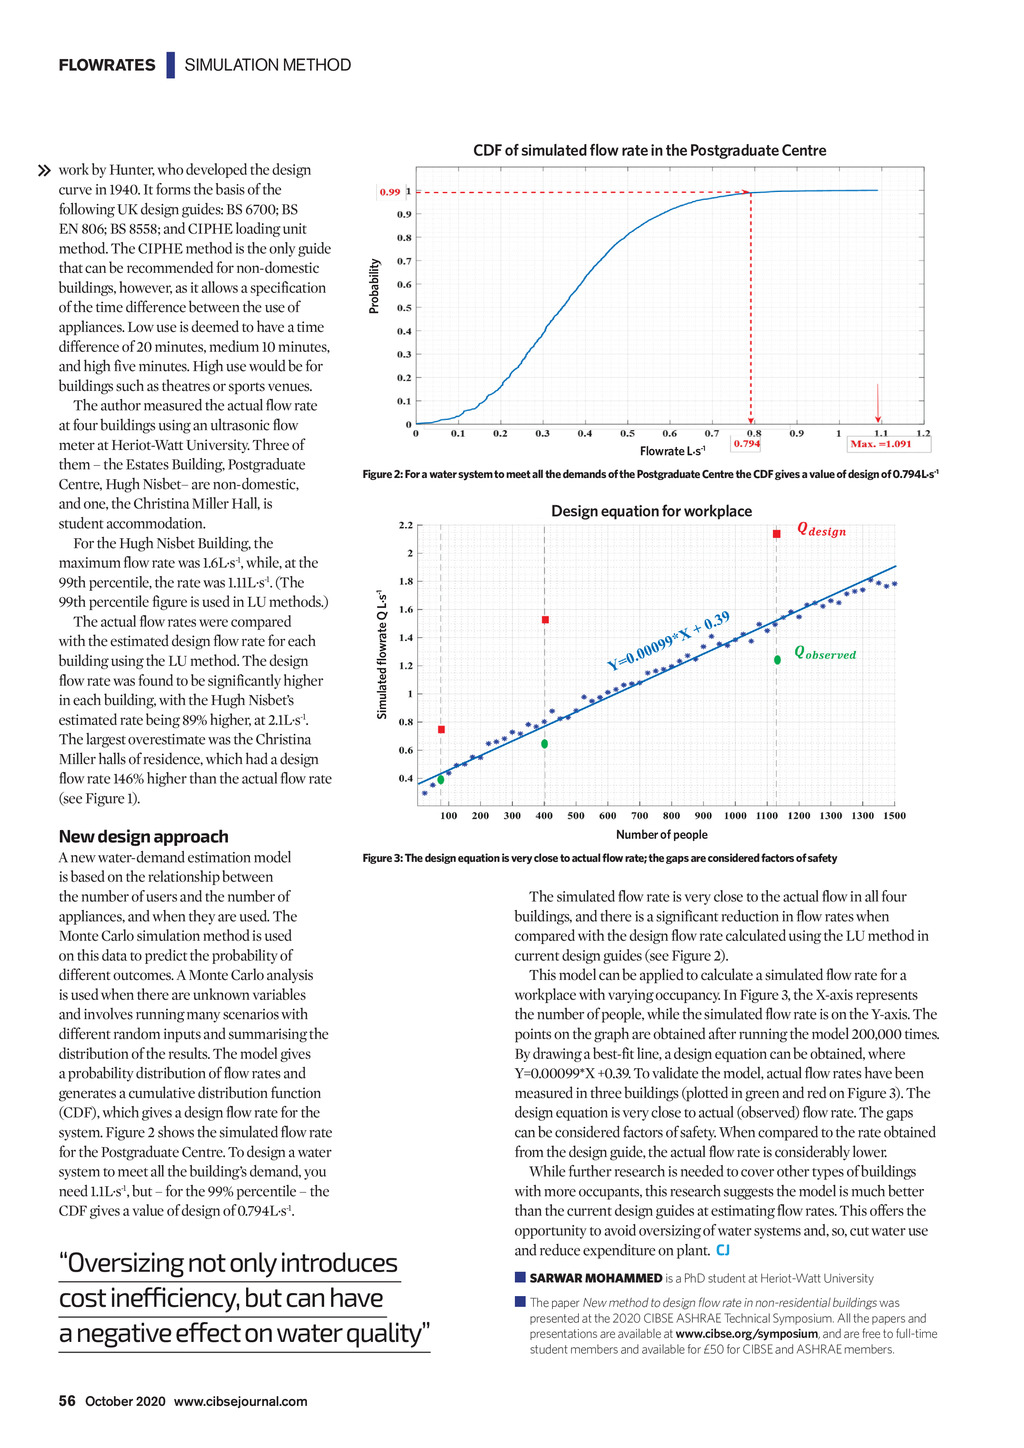


FLOWRATES | SIMULATION METHOD Probability CDF of simulated flow rate in the Postgraduate Centre Flowrate L.s-1 Figure 2: For a water system to meet all the demands of the Postgraduate Centre the CDF gives a value of design of 0.794L.s-1 Design equation for workplace Simulated flowrate Q L.s-1 work by Hunter, who developed the design curve in 1940. It forms the basis of the following UK design guides: BS 6700; BS EN 806; BS 8558; and CIPHE loading unit method. The CIPHE method is the only guide that can be recommended for non-domestic buildings, however, as it allows a specification of the time difference between the use of appliances. Low use is deemed to have a time difference of 20 minutes, medium 10 minutes, and high five minutes. High use would be for buildings such as theatres or sports venues. The author measured the actual flow rate at four buildings using an ultrasonic flow meter at Heriot-Watt University. Three of them the Estates Building, Postgraduate Centre, Hugh Nisbet are non-domestic, and one, the Christina Miller Hall, is student accommodation. For the Hugh Nisbet Building, the maximum flow rate was 1.6L.s-1, while, at the 99th percentile, the rate was 1.11L.s-1. (The 99th percentile figure is used in LU methods.) The actual flow rates were compared with the estimated design flow rate for each building using the LU method. The design flow rate was found to be significantly higher in each building, with the Hugh Nisbets estimated rate being 89% higher, at 2.1L.s-1. The largest overestimate was the Christina Miller halls of residence, which had a design flow rate 146% higher than the actual flow rate (see Figure 1). New design approach A new water-demand estimation model is based on the relationship between the number of users and the number of appliances, and when they are used. The Monte Carlo simulation method is used on this data to predict the probability of different outcomes. A Monte Carlo analysis is used when there are unknown variables and involves running many scenarios with different random inputs and summarising the distribution of the results. The model gives a probability distribution of flow rates and generates a cumulative distribution function (CDF), which gives a design flow rate for the system. Figure 2 shows the simulated flow rate for the Postgraduate Centre. To design a water system to meet all the buildings demand, you need 1.1L.s-1, but for the 99% percentile the CDF gives a value of design of 0.794L.s-1. Number of people Figure 3: The design equation is very close to actual flow rate; the gaps are considered factors of safety Oversizing not only introduces cost inefficiency, but can have a negative effect on water quality The simulated flow rate is very close to the actual flow in all four buildings, and there is a significant reduction in flow rates when compared with the design flow rate calculated using the LU method in current design guides (see Figure 2). This model can be applied to calculate a simulated flow rate for a workplace with varying occupancy. In Figure 3, the X-axis represents the number of people, while the simulated flow rate is on the Y-axis. The points on the graph are obtained after running the model 200,000 times. By drawing a best-fit line, a design equation can be obtained, where Y=0.00099*X +0.39. To validate the model, actual flow rates have been measured in three buildings (plotted in green and red on Figure 3). The design equation is very close to actual (observed) flow rate. The gaps can be considered factors of safety. When compared to the rate obtained from the design guide, the actual flow rate is considerably lower. While further research is needed to cover other types of buildings with more occupants, this research suggests the model is much better than the current design guides at estimating flow rates. This offers the opportunity to avoid oversizing of water systems and, so, cut water use and reduce expenditure on plant. CJ SARWAR MOHAMMED is a PhD student at Heriot-Watt University The paper New method to design flow rate in non-residential buildings was presented at the 2020 CIBSE ASHRAE Technical Symposium. All the papers and presentations are available at www.cibse.org/symposium, and are free to full-time student members and available for 50 for CIBSE and ASHRAE members. 56 October 2020 www.cibsejournal.com CIBSE Oct20 pp55-56 Flow rate method.indd 56 25/09/2020 16:47