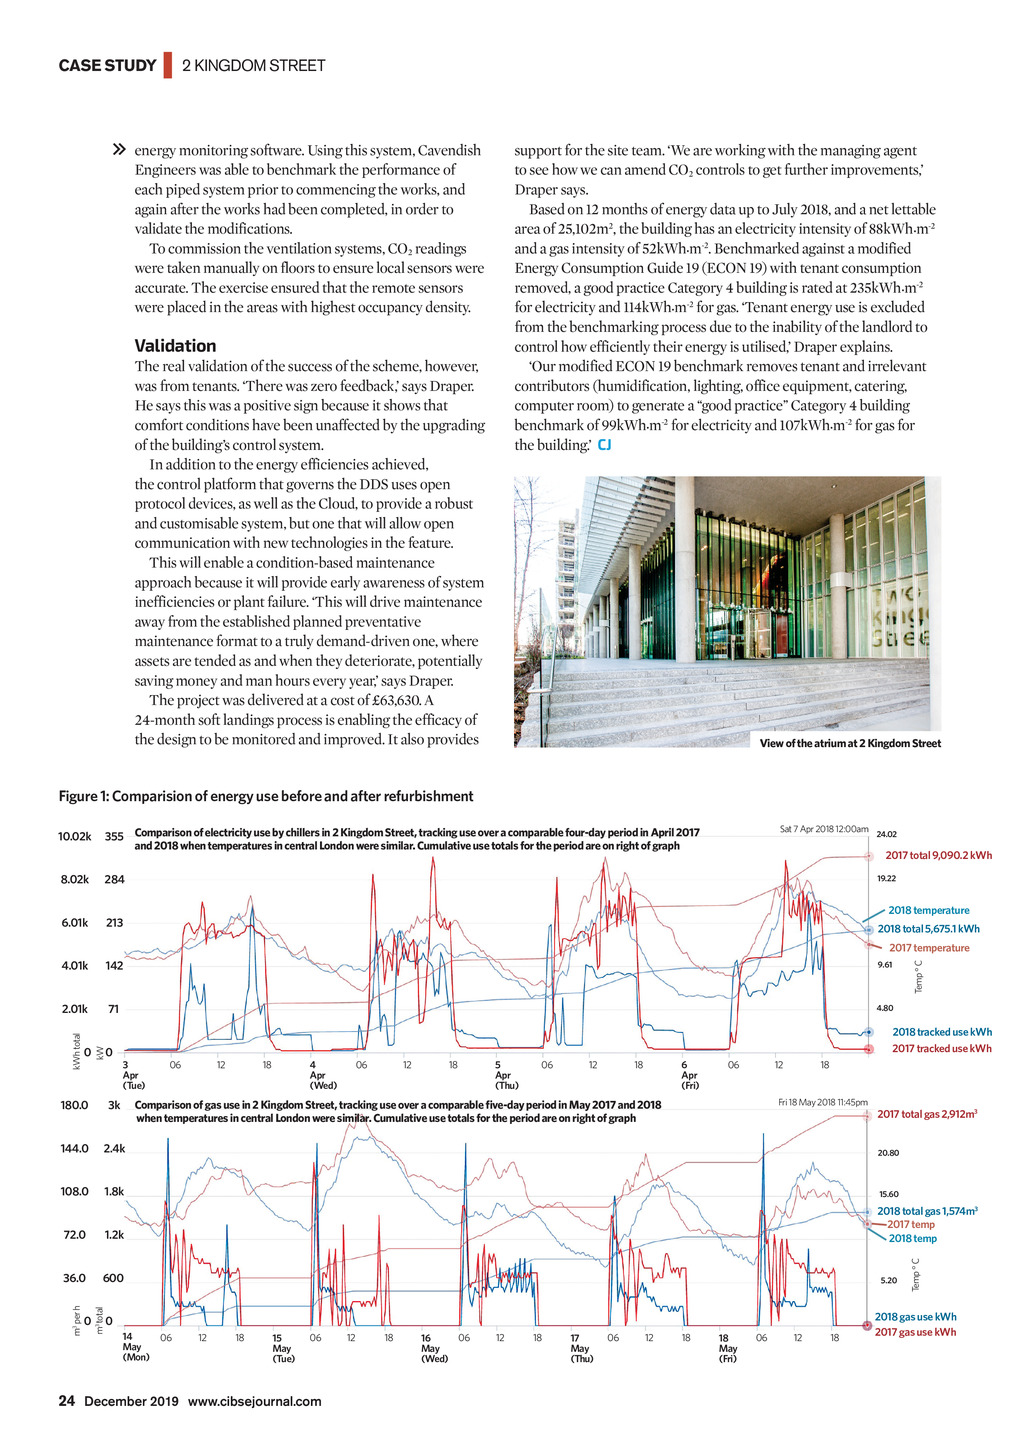

CASE STUDY | 2 KINGDOM STREET energy monitoring software. Using this system, Cavendish Engineers was able to benchmark the performance of each piped system prior to commencing the works, and again after the works had been completed, in order to validate the modifications. To commission the ventilation systems, CO2 readings were taken manually on floors to ensure local sensors were accurate. The exercise ensured that the remote sensors were placed in the areas with highest occupancy density. support for the site team. We are working with the managing agent to see how we can amend CO2 controls to get further improvements, Draper says. Based on 12 months of energy data up to July 2018, and a net lettable area of 25,102m2, the building has an electricity intensity of 88kWh.m-2 and a gas intensity of 52kWh.m-2. Benchmarked against a modified Energy Consumption Guide 19 (ECON 19) with tenant consumption removed, a good practice Category 4 building is rated at 235kWh.m-2 for electricity and 114kWh.m-2 for gas. Tenant energy use is excluded from the benchmarking process due to the inability of the landlord to control how efficiently their energy is utilised, Draper explains. Our modified ECON 19 benchmark removes tenant and irrelevant contributors (humidification, lighting, office equipment, catering, computer room) to generate a good practice Category 4 building benchmark of 99kWh.m-2 for electricity and 107kWh.m-2 for gas for the building. CJ Validation The real validation of the success of the scheme, however, was from tenants. There was zero feedback, says Draper. He says this was a positive sign because it shows that comfort conditions have been unaffected by the upgrading of the buildings control system. In addition to the energy efficiencies achieved, the control platform that governs the DDS uses open protocol devices, as well as the Cloud, to provide a robust and customisable system, but one that will allow open communication with new technologies in the feature. This will enable a condition-based maintenance approach because it will provide early awareness of system inefficiencies or plant failure. This will drive maintenance away from the established planned preventative maintenance format to a truly demand-driven one, where assets are tended as and when they deteriorate, potentially saving money and man hours every year, says Draper. The project was delivered at a cost of 63,630. A 24-month soft landings process is enabling the efficacy of the design to be monitored and improved. It also provides View of the atrium at 2 Kingdom Street Figure 1: Comparision of energy use before and after refurbishment Sat 7 Apr 2018 12:00am 24.02 10.02k 355 Comparison of electricity use by chillers in 2 Kingdom Street, tracking use over a comparable four-day period in April 2017 and 2018 when temperatures in central London were similar. Cumulative use totals for the period are on right of graph 8.02k 284 6.01k 213 4.01k 142 9.61 2.01k 71 4.80 2017 total 9,090.2 kWh 19.22 2018 temperature 2018 total 5,675.1 kWh 0 kW kWh total 0 3 Apr (Tue) 06 12 18 4 Apr (Wed) 06 12 18 5 Apr (Thu) 06 12 6 Apr (Fri) 18 06 12 2018 tracked use kWh 2017 0 tracked use kWh 18 Fri 18 May 2018 11:45pm Comparison of gas use in 2 Kingdom Street, tracking use over a comparable five-day period in May 2017 and 2018 when temperatures in central London were similar. Cumulative use totals for the period are on right of graph Temp C 2017 temperature 144.0 2.4k 108.0 1.8k 15.60 72.0 1.2k 2018 total gas 1,574m3 2017 temp 2018 temp 36.0 600 0 m3 total 3k m3 per h 180.0 5.20 06 12 18 15 May (Tue) 06 12 18 06 16 May (Wed) 12 18 17 May (Thu) 06 12 18 18 May (Fri) 06 12 18 Temp C 20.80 0 14 May (Mon) 2017 total gas 2,912m3 2018 gas use kWh 2017 gas use kWh 24 December 2019 www.cibsejournal.com CIBSE Dec19 pp22-24 Two Kingdom St.indd 24 22/11/2019 15:18