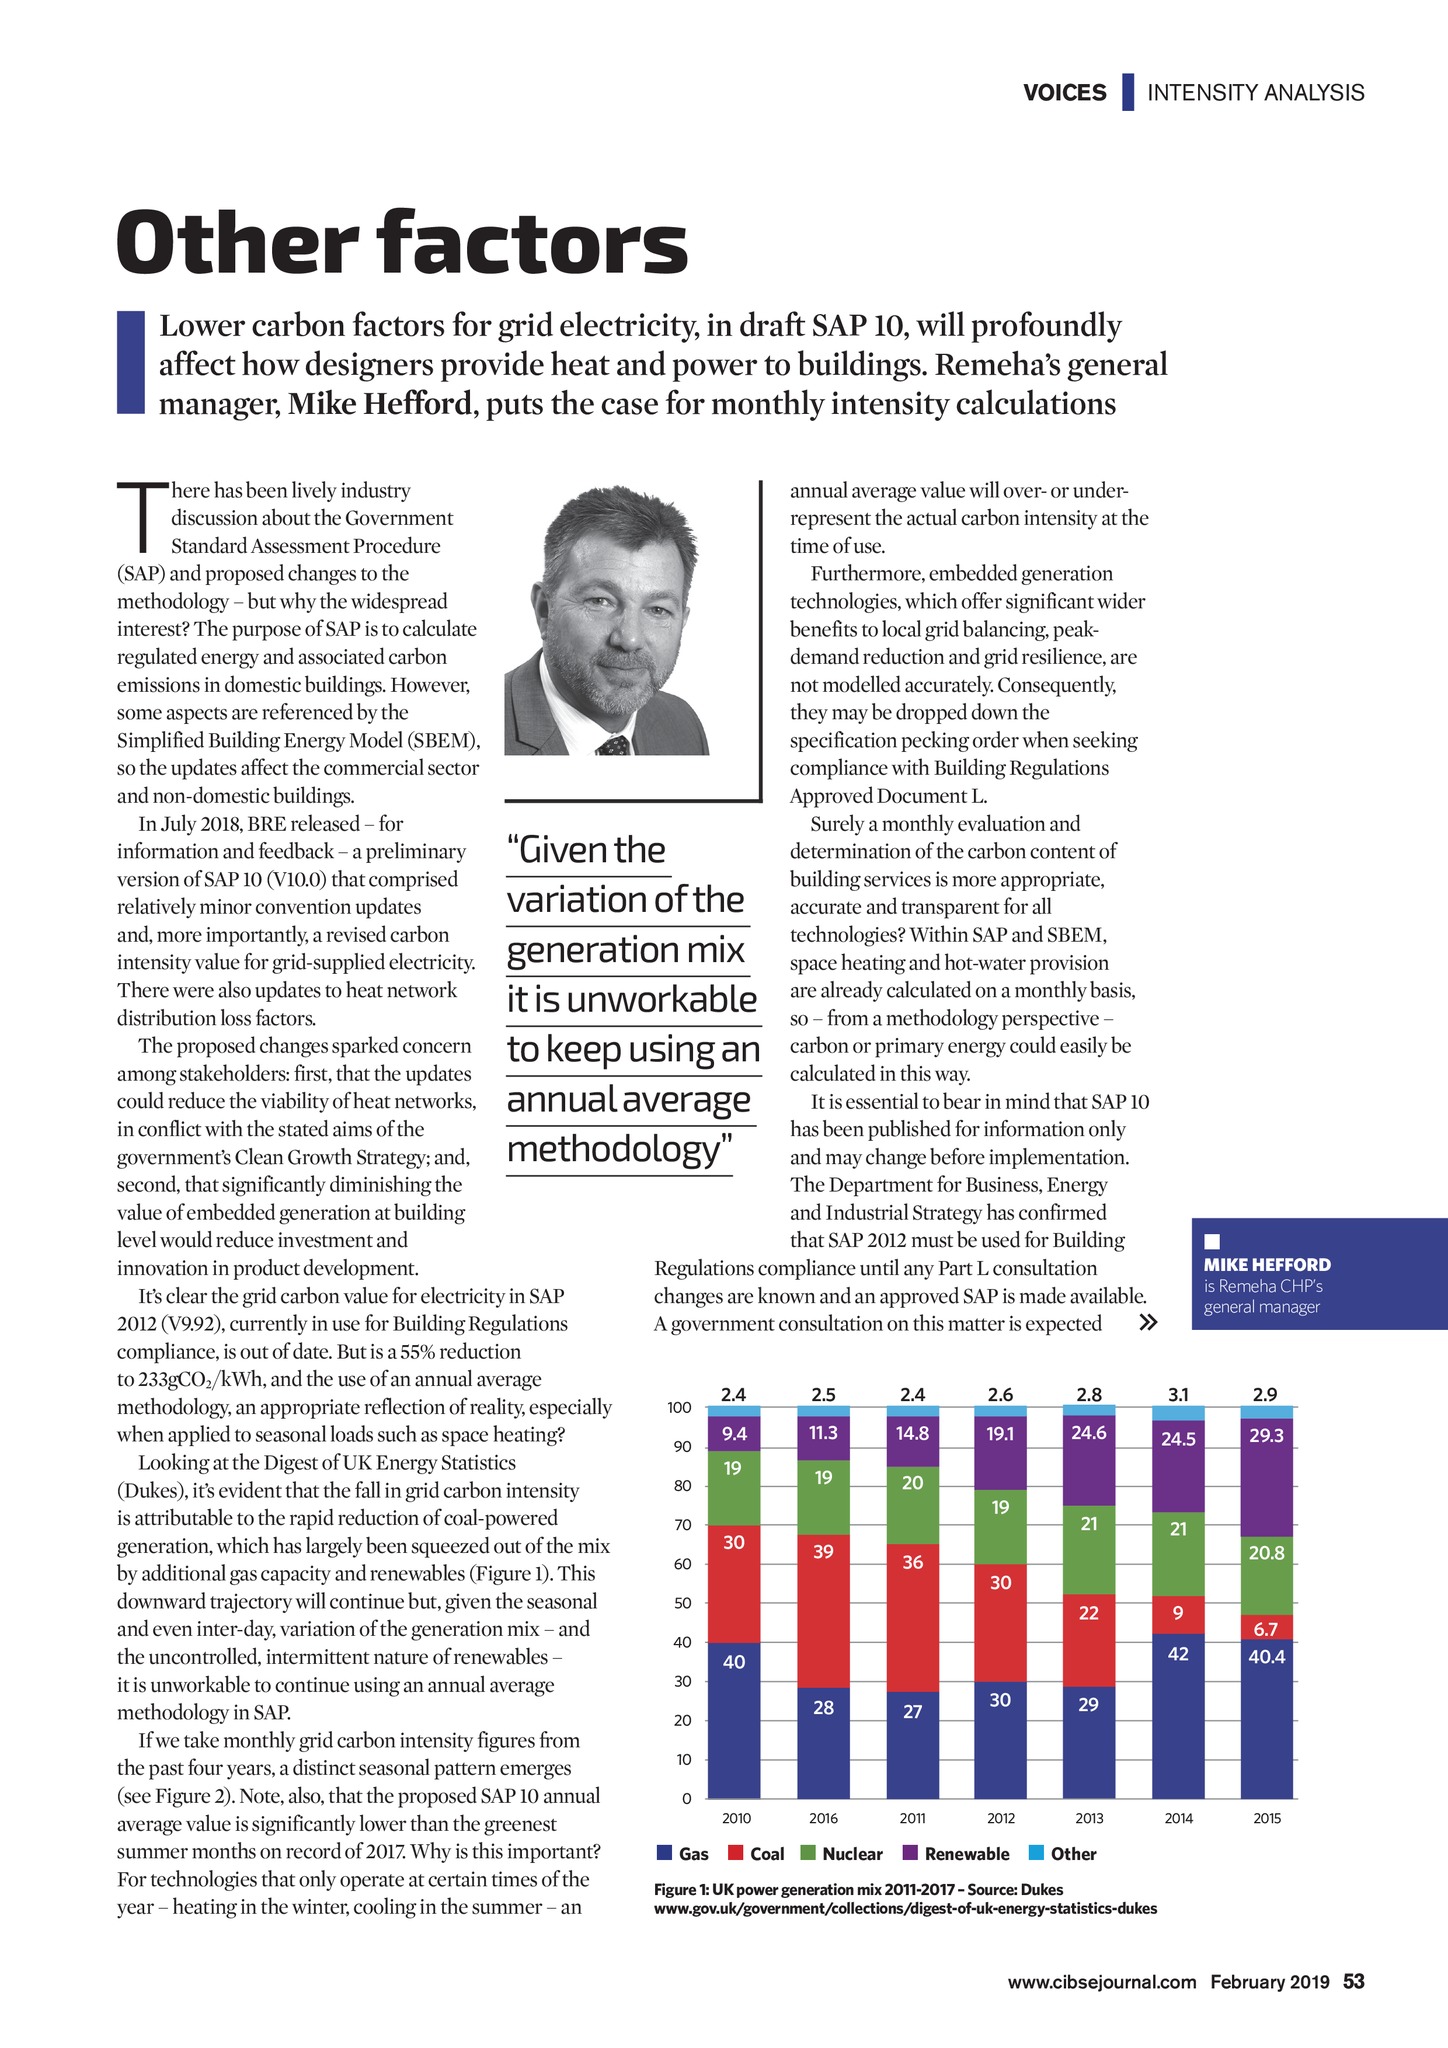

VOICES | INTENSITY ANALYSIS Other factors Lower carbon factors for grid electricity, in draft SAP 10, will profoundly affect how designers provide heat and power to buildings. Remehas general manager, Mike Hefford, puts the case for monthly intensity calculations T here has been lively industry discussion about the Government Standard Assessment Procedure (SAP) and proposed changes to the methodology but why the widespread interest? The purpose of SAP is to calculate regulated energy and associated carbon emissions in domestic buildings. However, some aspects are referenced by the Simplified Building Energy Model (SBEM), so the updates affect the commercial sector and non-domestic buildings. In July 2018, BRE released for information and feedback a preliminary version of SAP 10 (V10.0) that comprised relatively minor convention updates and, more importantly, a revised carbon intensity value for grid-supplied electricity. There were also updates to heat network distribution loss factors. The proposed changes sparked concern among stakeholders: first, that the updates could reduce the viability of heat networks, in conflict with the stated aims of the governments Clean Growth Strategy; and, second, that significantly diminishing the value of embedded generation at building level would reduce investment and innovation in product development. Its clear the grid carbon value for electricity in SAP 2012 (V9.92), currently in use for Building Regulations compliance, is out of date. But is a 55% reduction to 233gCO2/kWh, and the use of an annual average methodology, an appropriate reflection of reality, especially when applied to seasonal loads such as space heating? Looking at the Digest of UK Energy Statistics (Dukes), its evident that the fall in grid carbon intensity is attributable to the rapid reduction of coal-powered generation, which has largely been squeezed out of the mix by additional gas capacity and renewables (Figure 1). This downward trajectory will continue but, given the seasonal and even inter-day, variation of the generation mix and the uncontrolled, intermittent nature of renewables it is unworkable to continue using an annual average methodology in SAP. If we take monthly grid carbon intensity figures from the past four years, a distinct seasonal pattern emerges (see Figure 2). Note, also, that the proposed SAP 10 annual average value is significantly lower than the greenest summer months on record of 2017. Why is this important? For technologies that only operate at certain times of the year heating in the winter, cooling in the summer an annual average value will over- or underrepresent the actual carbon intensity at the time of use. Furthermore, embedded generation technologies, which offer significant wider benefits to local grid balancing, peakdemand reduction and grid resilience, are not modelled accurately. Consequently, they may be dropped down the specification pecking order when seeking compliance with Building Regulations Approved Document L. Surely a monthly evaluation and determination of the carbon content of building services is more appropriate, accurate and transparent for all technologies? Within SAP and SBEM, space heating and hot-water provision are already calculated on a monthly basis, so from a methodology perspective carbon or primary energy could easily be calculated in this way. It is essential to bear in mind that SAP 10 has been published for information only and may change before implementation. The Department for Business, Energy and Industrial Strategy has confirmed that SAP 2012 must be used for Building Regulations compliance until any Part L consultation changes are known and an approved SAP is made available. A government consultation on this matter is expected Given the variation of the generation mix it is unworkable to keep using an annual average methodology 100 90 80 70 2.5 2.4 2.6 2.8 3.1 2.9 9.4 11.3 14.8 19.1 24.6 24.5 29.3 19 19 20 21 21 19 30 39 36 20.8 30 50 30 MIKE HEFFORD is Remeha CHPs general manager 2.4 60 40 22 40 20 28 27 2016 2011 30 29 2012 2013 9 42 6.7 40.4 2014 2015 10 0 2010 Gas Coal Nuclear Renewable Other Figure 1: UK power generation mix 2011-2017 Source: Dukes www.gov.uk/government/collections/digest-of-uk-energy-statistics-dukes www.cibsejournal.com February 2019 53 CIBSE Feb19 pp53-54 Remeha.indd 53 25/01/2019 16:03