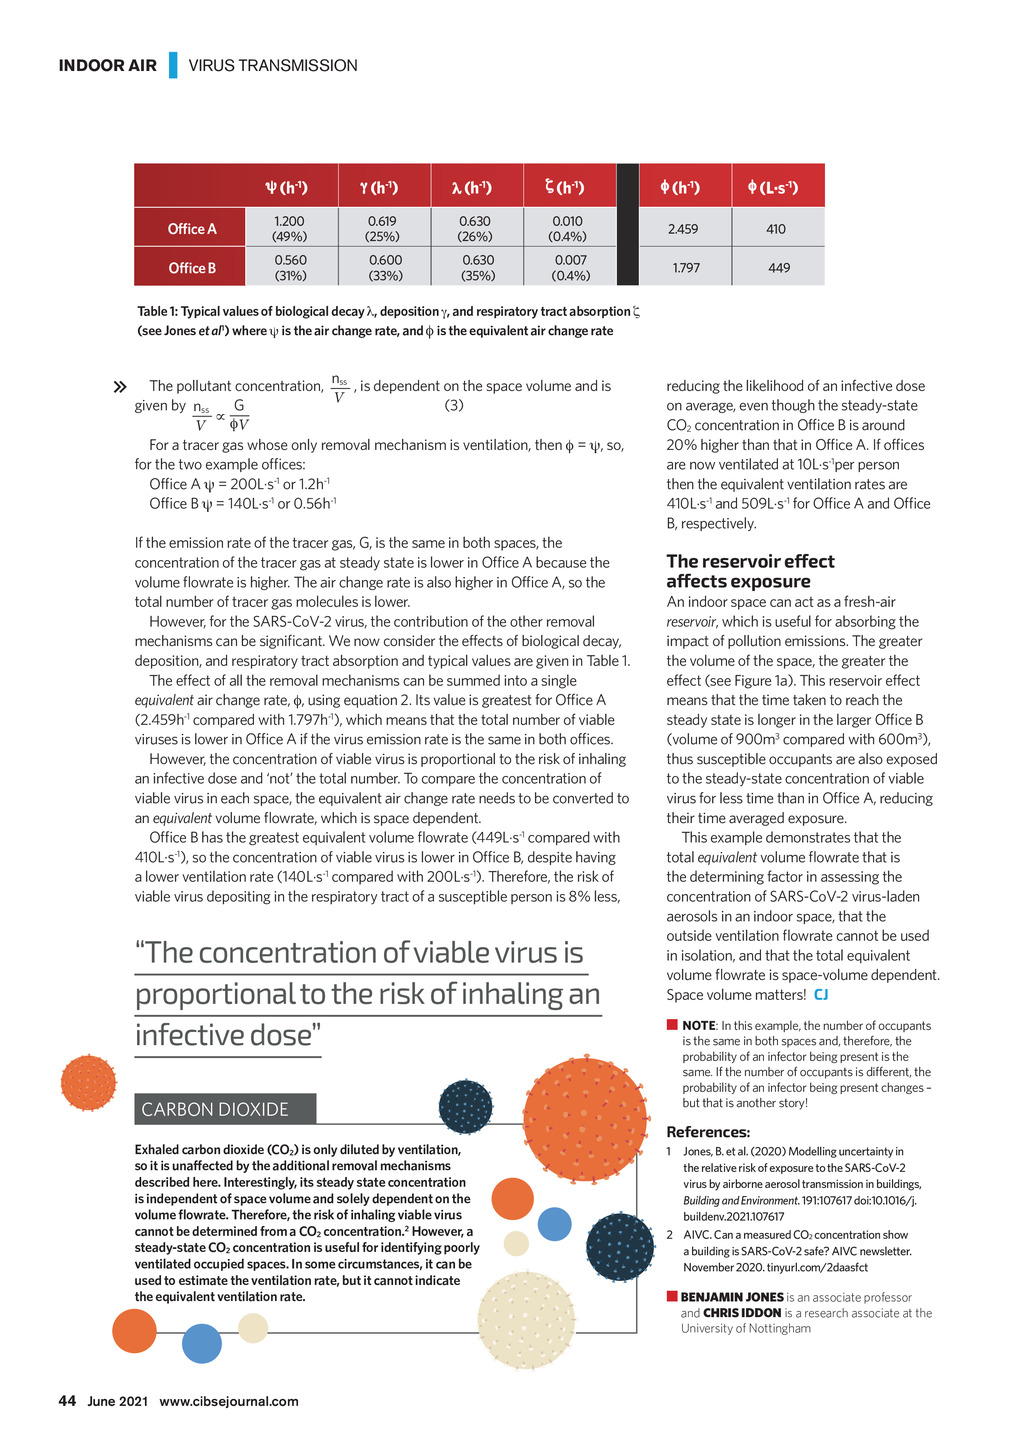


INDOOR AIR | VIRUS TRANSMISSION (h-1) (h-1) (h-1) (h-1) (h-1) (L.s-1) 1.200 (49%) 0.619 (25%) 0.630 (26%) 0.010 (0.4%) 2.459 410 0.560 (31%) 0.600 (33%) 0.630 (35%) 0.007 (0.4%) 1.797 449 et al The pollutant concentration, nss , is dependent on the space volume and is V (3) given by nss G V V For a tracer gas whose only removal mechanism is ventilation, then = , so, = 200L.s-1 or 1.2h-1 = 140L.s-1 or 0.56h-1 If the emission rate of the tracer gas, G, is the same in both spaces, the total number of tracer gas molecules is lower. deposition, and respiratory tract absorption and typical values are given in Table 1. The effect of all the removal mechanisms can be summed into a single equivalent air change rate, (2.459h-1 compared with 1.797h-1), which means that the total number of viable However, the concentration of viable virus is proportional to the risk of inhaling an infective dose and not the total number. To compare the concentration of viable virus in each space, the equivalent air change rate needs to be converted to an equivalent .s-1 compared with -1 . 410L s a lower ventilation rate (140L.s-1 compared with 200L.s-1). Therefore, the risk of viable virus depositing in the respiratory tract of a susceptible person is 8% less, The concentration of viable virus is proportional to the risk of inhaling an infective dose reducing the likelihood of an infective dose on average, even though the steady-state 2 are now ventilated at 10L.s-1per person then the equivalent ventilation rates are 410L.s-1 and 509L.s-1 The reservoir effect affects exposure reservoir, which is useful for absorbing the impact of pollution emissions. The greater the volume of the space, the greater the effect (see Figure 1a). This reservoir effect means that the time taken to reach the (volume of 900m3 compared with 600m3), thus susceptible occupants are also exposed to the steady-state concentration of viable their time averaged exposure. This example demonstrates that the total equivalent the determining factor in assessing the aerosols in an indoor space, that the in isolation, and that the total equivalent Space volume matters! CJ NOTE is the same in both spaces and, therefore, the probability of an infector being present is the same. If the number of occupants is different, the probability of an infector being present changes but that is another story! References: 1 2 2 2 2 Jones, B. et al. (2020) Modelling uncertainty in the relative risk of exposure to the SARS-CoV-2 virus by airborne aerosol transmission in buildings, Building and Environment. 191:107617 doi:10.1016/j. buildenv.2021.107617 2 AIVC. Can a measured CO2 concentration show a building is SARS-CoV-2 safe? AIVC newsletter. November 2020. tinyurl.com/2daasfct BENJAMIN JONES is an associate professor and CHRIS IDDON is a research associate at the University of Nottingham 44 June 2021 www.cibsejournal.com CIBSE June 21 pp42-44 Covid in the office Supp.indd 44 21/05/2021 17:55