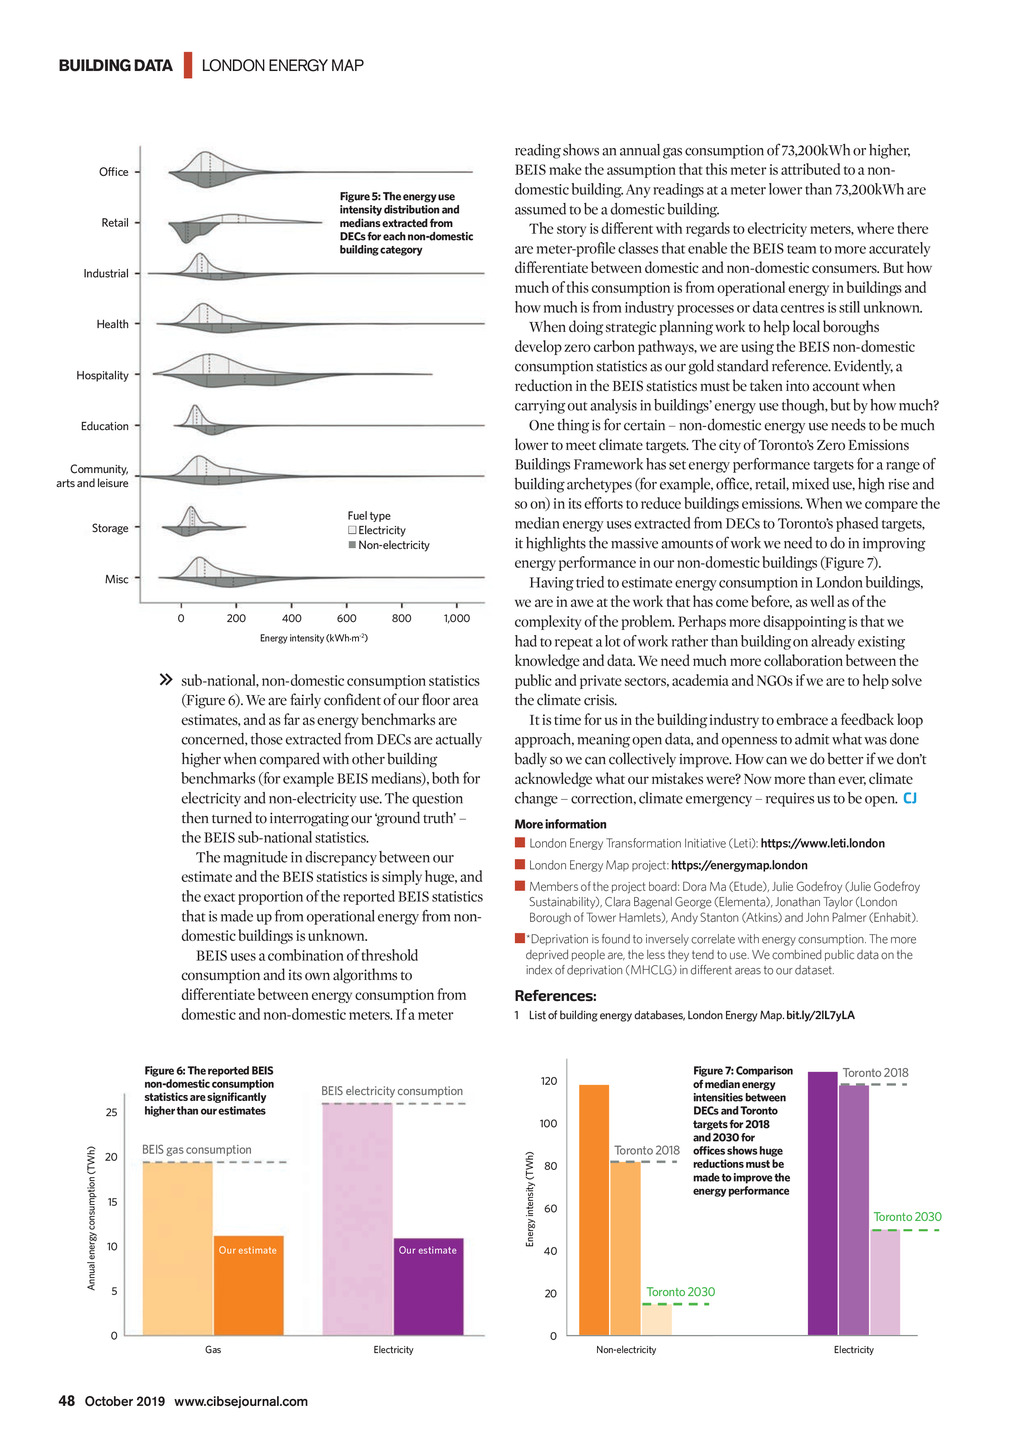


| LONDON ENERGY MAP ffice Figure 5: The energy use intensity distribution and medians extracted from DECs for each non-domestic building category Retail Industrial Health Hospitality Education Community, arts and leisure Fuel type n Electricity n Non-electricity Storage Misc 0 200 400 600 800 1,000 Energy intensity (kWh.m-2) sub-national, non-domestic consumption statistics (Figure 6). We are fairly confident of our floor area estimates, and as far as energy benchmarks are concerned, those extracted from DECs are actually higher when compared with other building benchmarks (for example BEIS medians), both for electricity and non-electricity use. The question then turned to interrogating our ground truth the BEIS sub-national statistics. The magnitude in discrepancy between our estimate and the BEIS statistics is simply huge, and the exact proportion of the reported BEIS statistics that is made up from operational energy from nondomestic buildings is unknown. BEIS uses a combination of threshold consumption and its own algorithms to differentiate between energy consumption from domestic and non-domestic meters. If a meter Annual energy consumption (TWh) 25 20 Figure 6: The reported BEIS non-domestic consumption statistics are signi cantly higher than our estimates London Energy Map project: https://energymap.london Members of the project board: Dora Ma (Etude), Julie Godefroy (Julie Godefroy Sustainability), Clara Bagenal George (Elementa), Jonathan Taylor (London Borough of Tower Hamlets), Andy Stanton (Atkins) and John Palmer (Enhabit). *Deprivation is found to inversely correlate with energy consumption. The more deprived people are, the less they tend to use. We combined public data on the index of deprivation (MHCLG) in different areas to our dataset. References: 1 List of building energy databases, London Energy Map. bit.ly/2lL7yLA 120 100 BE S gas consumption Our estimate More information London Energy Transformation Initiative (Leti): https://www.leti.london BE S electricity consumption 15 10 reading shows an annual gas consumption of 73,200kWh or higher, BEIS make the assumption that this meter is attributed to a nondomestic building. Any readings at a meter lower than 73,200kWh are assumed to be a domestic building. The story is different with regards to electricity meters, where there are meter-profile classes that enable the BEIS team to more accurately differentiate between domestic and non-domestic consumers. But how much of this consumption is from operational energy in buildings and how much is from industry processes or data centres is still unknown. When doing strategic planning work to help local boroughs develop zero carbon pathways, we are using the BEIS non-domestic consumption statistics as our gold standard reference. Evidently, a reduction in the BEIS statistics must be taken into account when carrying out analysis in buildings energy use though, but by how much? One thing is for certain non-domestic energy use needs to be much lower to meet climate targets. The city of Torontos Zero Emissions Buildings Framework has set energy performance targets for a range of building archetypes (for example, office, retail, mixed use, high rise and so on) in its efforts to reduce buildings emissions. When we compare the median energy uses extracted from DECs to Torontos phased targets, it highlights the massive amounts of work we need to do in improving energy performance in our non-domestic buildings (Figure 7). Having tried to estimate energy consumption in London buildings, we are in awe at the work that has come before, as well as of the complexity of the problem. Perhaps more disappointing is that we had to repeat a lot of work rather than building on already existing knowledge and data. We need much more collaboration between the public and private sectors, academia and NGOs if we are to help solve the climate crisis. It is time for us in the building industry to embrace a feedback loop approach, meaning open data, and openness to admit what was done badly so we can collectively improve. How can we do better if we dont acknowledge what our mistakes were? Now more than ever, climate change correction, climate emergency requires us to be open. CJ Our estimate 5 Energy intensity (TWh) BUILDING DATA Toronto 2018 80 60 Toronto 2018 Toronto 2030 40 20 0 Figure 7: Comparison of median energy intensities between DECs and Toronto targets for 2018 and 2030 for of ces shows huge reductions must be made to improve the energy performance Toronto 2030 0 Gas Electricity Non-electricity Electricity 48 October 2019 www.cibsejournal.com CIBSE Oct19 pp46-48 London energy map.indd 48 20/09/2019 18:16