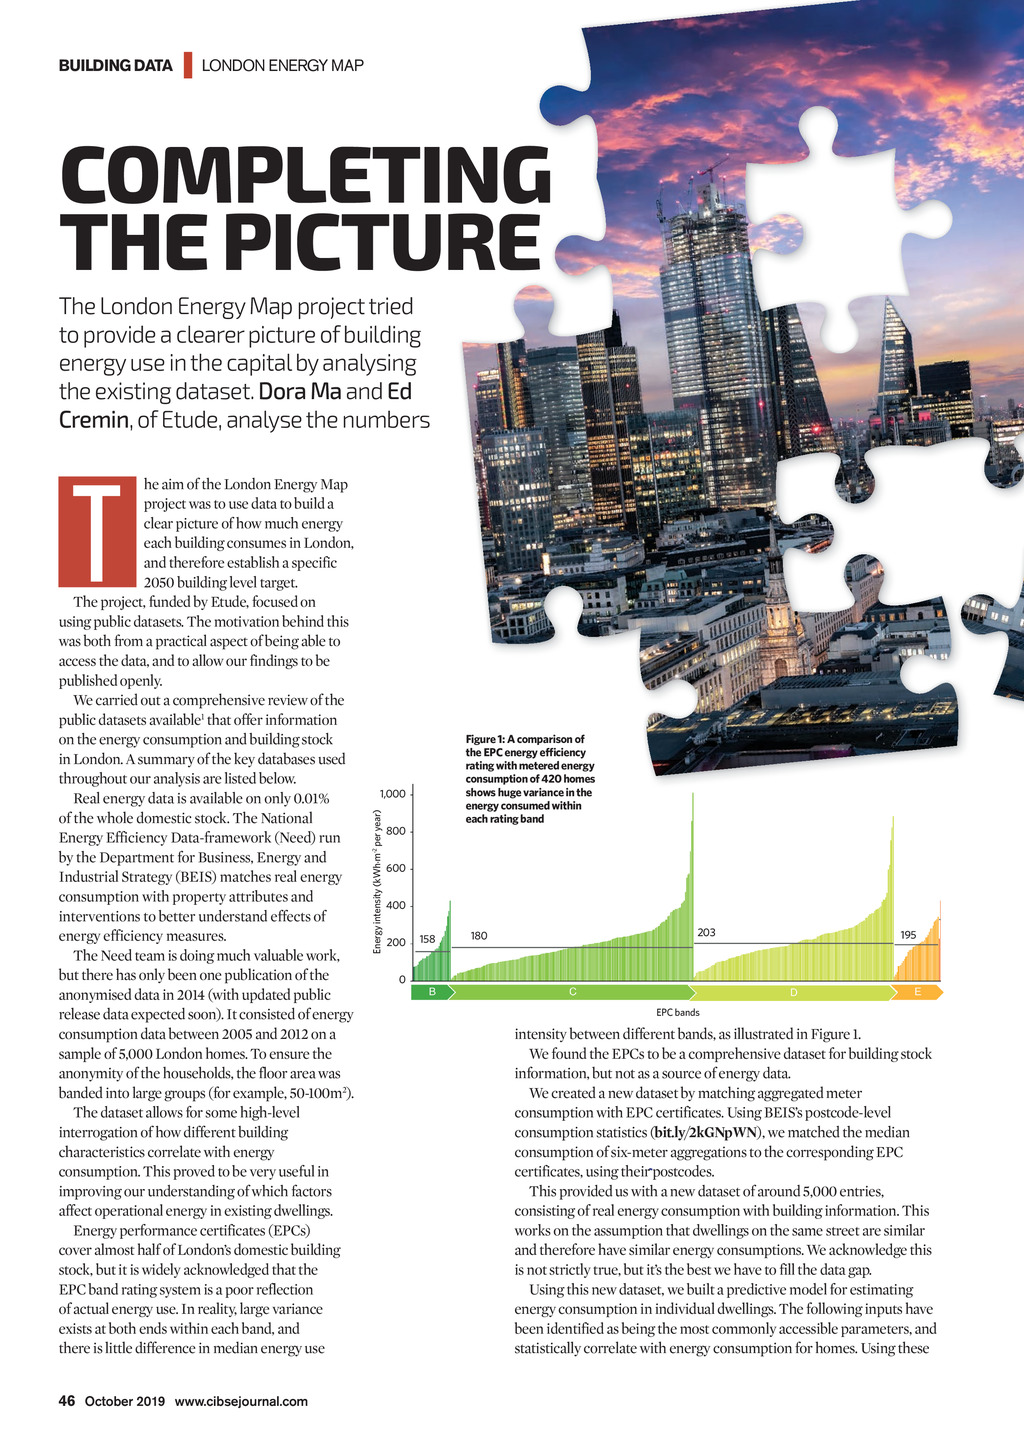


BUILDING DATA | LONDON ENERGY MAP COMPLETING THE PICTURE The London Energy Map project tried to provide a clearer picture of building energy use in the capital by analysing the existing dataset. Dora Ma and Ed Cremin, of Etude, analyse the numbers T Figure 1: A comparison of the E energy ef ciency rating with metered energy consumption of 420 homes shows huge variance in the energy consumed within each rating band 1,000 Energy intensity (kWh.m-2 per year) he aim of the London Energy Map project was to use data to build a clear picture of how much energy each building consumes in London, and therefore establish a specific 2050 building level target. The project, funded by Etude, focused on using public datasets. The motivation behind this was both from a practical aspect of being able to access the data, and to allow our findings to be published openly. We carried out a comprehensive review of the public datasets available1 that offer information on the energy consumption and building stock in London. A summary of the key databases used throughout our analysis are listed below. Real energy data is available on only 0.01% of the whole domestic stock. The National Energy Efficiency Data-framework (Need) run by the Department for Business, Energy and Industrial Strategy (BEIS) matches real energy consumption with property attributes and interventions to better understand effects of energy efficiency measures. The Need team is doing much valuable work, but there has only been one publication of the anonymised data in 2014 (with updated public release data expected soon). It consisted of energy consumption data between 2005 and 2012 on a sample of 5,000 London homes. To ensure the anonymity of the households, the floor area was banded into large groups (for example, 50-100m2). The dataset allows for some high-level interrogation of how different building characteristics correlate with energy consumption. This proved to be very useful in improving our understanding of which factors affect operational energy in existing dwellings. Energy performance certificates (EPCs) cover almost half of Londons domestic building stock, but it is widely acknowledged that the EPC band rating system is a poor reflection of actual energy use. In reality, large variance exists at both ends within each band, and there is little difference in median energy use 800 600 400 200 158 180 203 195 0 EPC bands intensity between different bands, as illustrated in Figure 1. We found the EPCs to be a comprehensive dataset for building stock information, but not as a source of energy data. We created a new dataset by matching aggregated meter consumption with EPC certificates. Using BEISs postcode-level consumption statistics (bit.ly/2kGNpWN), we matched the median consumption of six-meter aggregations to the corresponding EPC certificates, using their postcodes. This provided us with a new dataset of around 5,000 entries, consisting of real energy consumption with building information. This works on the assumption that dwellings on the same street are similar and therefore have similar energy consumptions. We acknowledge this is not strictly true, but its the best we have to fill the data gap. Using this new dataset, we built a predictive model for estimating energy consumption in individual dwellings. The following inputs have been identified as being the most commonly accessible parameters, and statistically correlate with energy consumption for homes. Using these 46 October 2019 www.cibsejournal.com CIBSE Oct19 pp46-48 London energy map.indd 46 20/09/2019 15:55