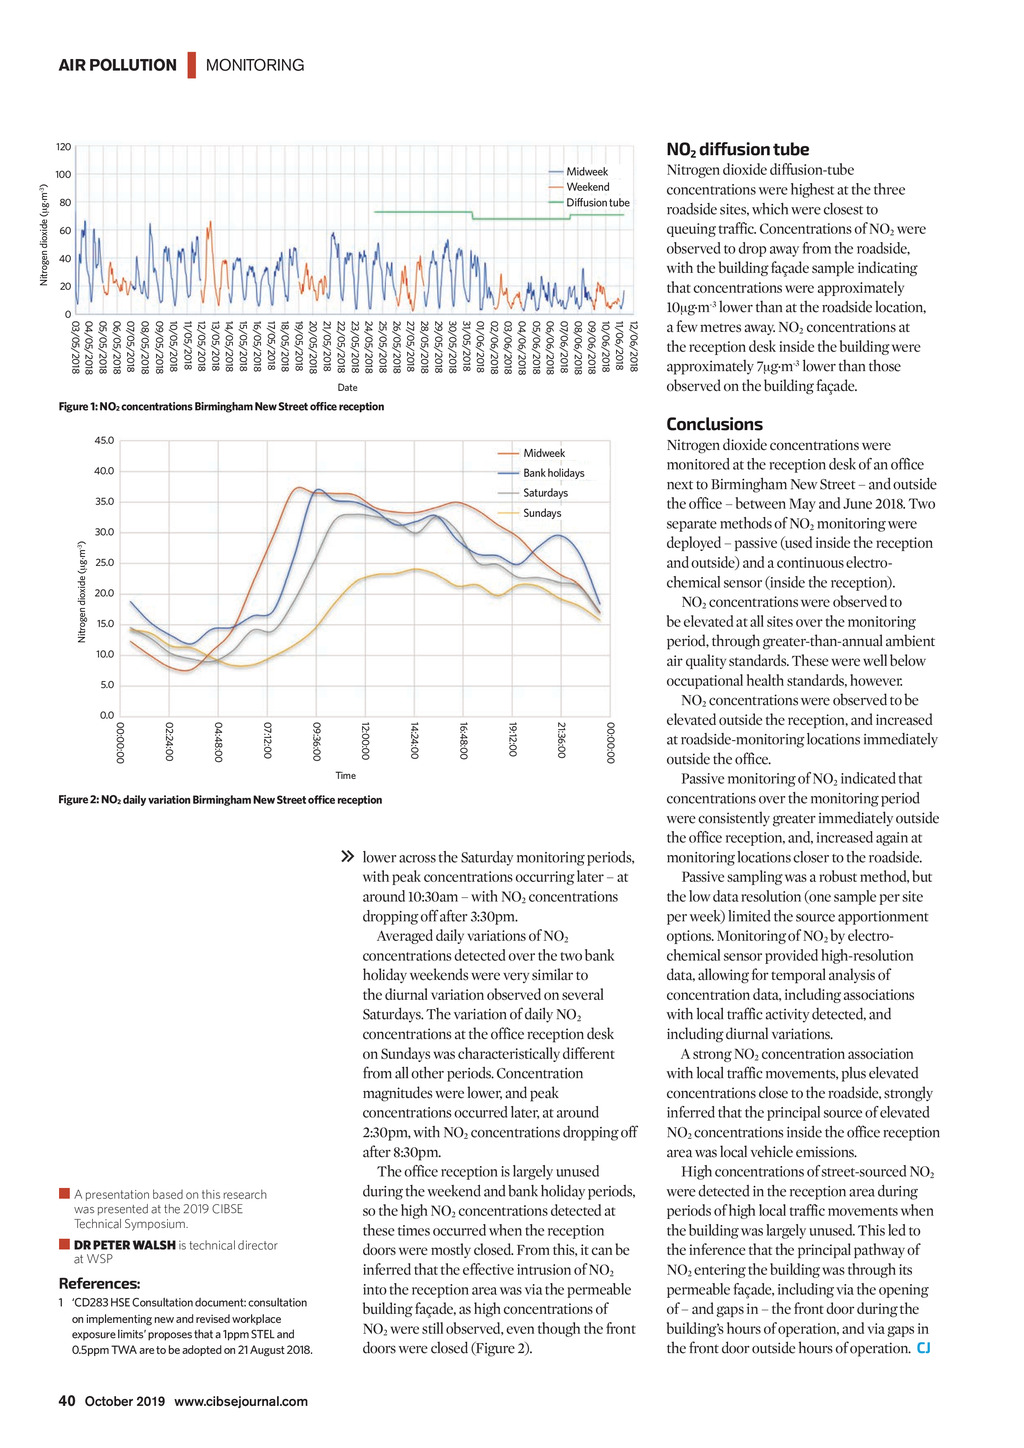


AIR POLLUTION | MONITORING NO2 diffusion tube 120 Midweek Weekend Diffusion tube Nitrogen dioxide ( g.m-3) 100 80 60 40 20 0 12/06/2018 11/06/2018 10/06/2018 09/06/2018 08/06/2018 07/06/2018 06/06/2018 05/06/2018 04/06/2018 03/06/2018 02/06/2018 01/06/2018 31/05/2018 30/05/2018 29/05/2018 28/05/2018 27/05/2018 26/05/2018 25/05/2018 24/05/2018 23/05/2018 22/05/2018 21/05/2018 20/05/2018 19/05/2018 18/05/2018 17/05/2018 16/05/2018 15/05/2018 14/05/2018 13/05/2018 12/05/2018 11/05/2018 10/05/2018 09/05/2018 08/05/2018 07/05/2018 06/05/2018 05/05/2018 04/05/2018 03/05/2018 Date Nitrogen dioxide diffusion-tube concentrations were highest at the three roadside sites, which were closest to queuing traffic. Concentrations of NO2 were observed to drop away from the roadside, with the building faade sample indicating that concentrations were approximately 10 g.m-3 lower than at the roadside location, a few metres away. NO2 concentrations at the reception desk inside the building were approximately 7 g.m-3 lower than those observed on the building faade. Figure 1: NO2 concentrations irmingham ew Street of ce reception Conclusions 45.0 Midweek 40.0 Bank holidays Saturdays 35.0 Sundays Nitrogen dioxide ( g.m-3) 30.0 25.0 20.0 15.0 10.0 5.0 0.0 00:00:00 21:36:00 19:12:00 16:48:00 14:24:00 12:00:00 09:36:00 07:12:00 04:48:00 02:24:00 00:00:00 Time Figure 2: NO2 daily variation irmingham ew Street of ce reception A presentation based on this research was presented at the 2019 CIBSE Technical Symposium. DR PETER WALSH is technical director at WSP References: 1 CD283 HSE Consultation document: consultation on implementing new and revised workplace exposure limits proposes that a 1ppm STEL and 0.5ppm TWA are to be adopted on 21 August 2018. lower across the Saturday monitoring periods, with peak concentrations occurring later at around 10:30am with NO2 concentrations dropping off after 3:30pm. Averaged daily variations of NO2 concentrations detected over the two bank holiday weekends were very similar to the diurnal variation observed on several Saturdays. The variation of daily NO2 concentrations at the office reception desk on Sundays was characteristically different from all other periods. Concentration magnitudes were lower, and peak concentrations occurred later, at around 2:30pm, with NO2 concentrations dropping off after 8:30pm. The office reception is largely unused during the weekend and bank holiday periods, so the high NO2 concentrations detected at these times occurred when the reception doors were mostly closed. From this, it can be inferred that the effective intrusion of NO2 into the reception area was via the permeable building faade, as high concentrations of NO2 were still observed, even though the front doors were closed (Figure 2). Nitrogen dioxide concentrations were monitored at the reception desk of an office next to Birmingham New Street and outside the office between May and June 2018. Two separate methods of NO2 monitoring were deployed passive (used inside the reception and outside) and a continuous electrochemical sensor (inside the reception). NO2 concentrations were observed to be elevated at all sites over the monitoring period, through greater-than-annual ambient air quality standards. These were well below occupational health standards, however. NO2 concentrations were observed to be elevated outside the reception, and increased at roadside-monitoring locations immediately outside the office. Passive monitoring of NO2 indicated that concentrations over the monitoring period were consistently greater immediately outside the office reception, and, increased again at monitoring locations closer to the roadside. Passive sampling was a robust method, but the low data resolution (one sample per site per week) limited the source apportionment options. Monitoring of NO2 by electrochemical sensor provided high-resolution data, allowing for temporal analysis of concentration data, including associations with local traffic activity detected, and including diurnal variations. A strong NO2 concentration association with local traffic movements, plus elevated concentrations close to the roadside, strongly inferred that the principal source of elevated NO2 concentrations inside the office reception area was local vehicle emissions. High concentrations of street-sourced NO2 were detected in the reception area during periods of high local traffic movements when the building was largely unused. This led to the inference that the principal pathway of NO2 entering the building was through its permeable faade, including via the opening of and gaps in the front door during the buildings hours of operation, and via gaps in the front door outside hours of operation. CJ 40 October 2019 www.cibsejournal.com CIBSE Oct19 pp38-40 Birmingham .indd 40 20/09/2019 16:19