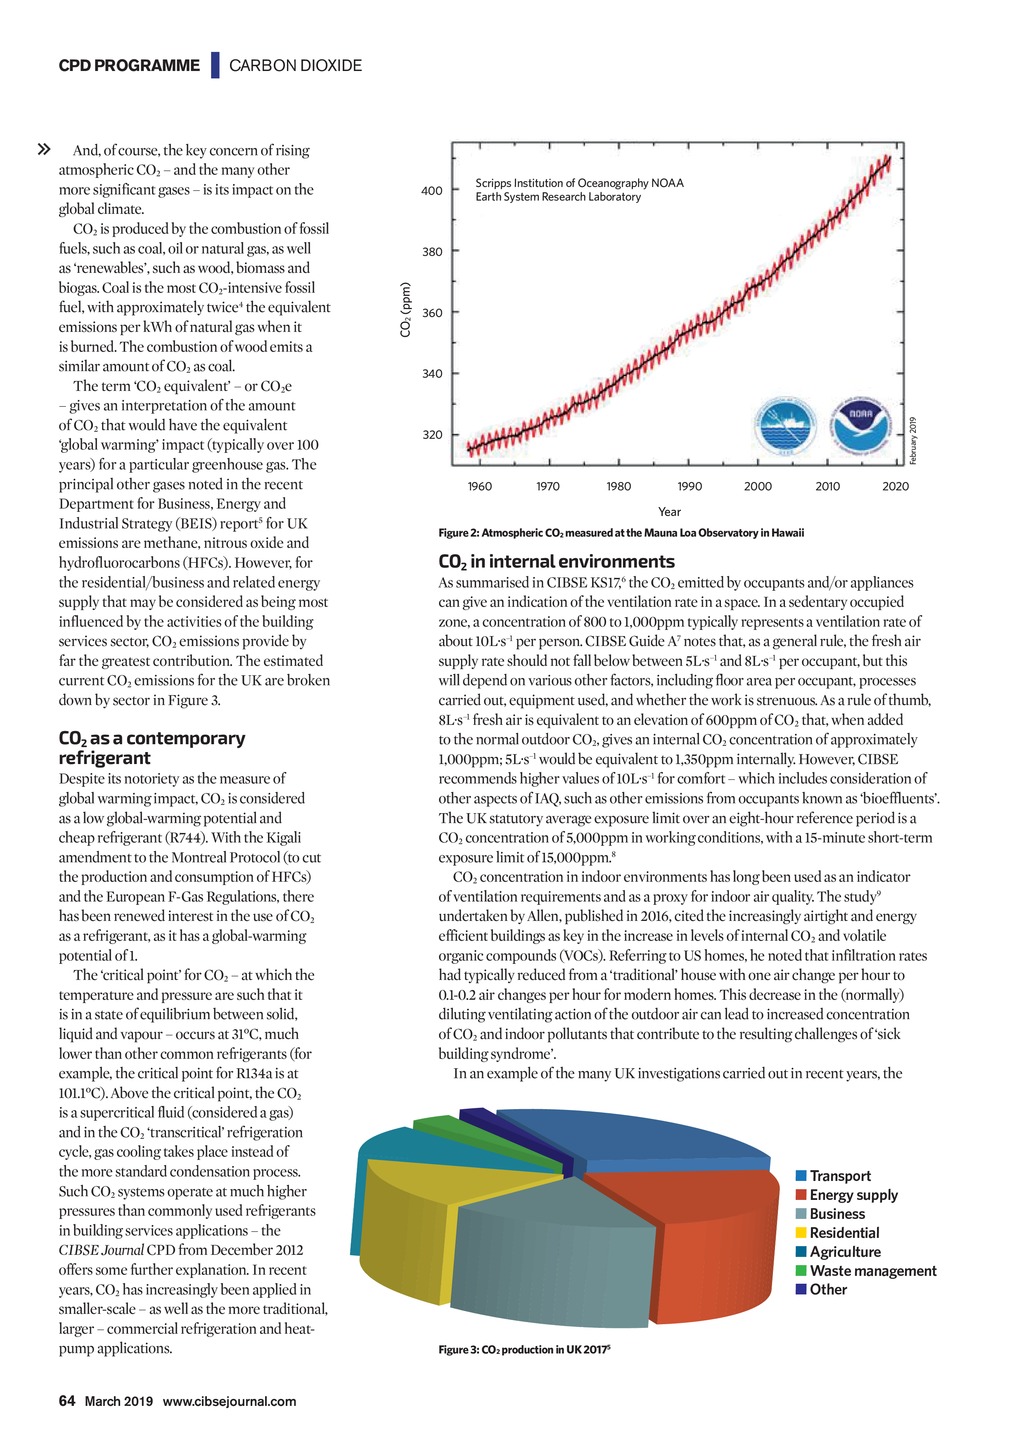


| CARBON DIOXIDE CO2 as a contemporary refrigerant Despite its notoriety as the measure of global warming impact, CO2 is considered as a low global-warming potential and cheap refrigerant (R744). With the Kigali amendment to the Montreal Protocol (to cut the production and consumption of HFCs) and the European F-Gas Regulations, there has been renewed interest in the use of CO2 as a refrigerant, as it has a global-warming potential of 1. The critical point for CO2 at which the temperature and pressure are such that it is in a state of equilibrium between solid, liquid and vapour occurs at 31C, much lower than other common refrigerants (for example, the critical point for R134a is at 101.1C). Above the critical point, the CO2 is a supercritical fluid (considered a gas) and in the CO2 transcritical refrigeration cycle, gas cooling takes place instead of the more standard condensation process. Such CO2 systems operate at much higher pressures than commonly used refrigerants in buildingservices applications the CIBSEJournal CPD from December 2012 offers some further explanation. In recent years, CO2 hasincreasingly been applied in smaller-scale as well as the more traditional, larger commercial refrigeration and heatpump applications. 400 Scripps Institution of Oceanography NOAA Earth System Research Laboratory 380 360 340 February 2019 And, of course, the key concern of rising atmospheric CO2 and the many other moresignificant gases is its impact on the global climate. CO2 is produced by the combustion of fossil fuels, such as coal, oil or natural gas, as well as renewables, such as wood, biomass and biogas. Coal is the most CO2-intensive fossil fuel, with approximately twice4 the equivalent emissions per kWh of natural gas when it is burned. The combustion of wood emits a similar amount of CO2 as coal. The term CO2 equivalent or CO2e gives an interpretation of the amount of CO2 that would have the equivalent global warming impact (typically over 100 years) for a particular greenhouse gas. The principal other gases noted in the recent Department for Business, Energy and Industrial Strategy (BEIS) report5 for UK emissions are methane, nitrous oxide and hydrofluorocarbons (HFCs). However, for the residential/business and related energy supply that may be considered as being most influenced by the activities of the building services sector, CO2 emissions provide by far the greatest contribution. The estimated current CO2 emissions for the UK are broken down by sector in Figure 3. CO2 (ppm) CPD PROGRAMME 320 1960 1970 1980 1990 2000 2010 2020 Year Figure 2: Atmospheric CO2 measured at the Mauna Loa Observatory in Hawaii CO2 in internal environments As summarised in CIBSE KS17,6 the CO2 emitted by occupants and/or appliances can give an indication of the ventilation rate in a space. In a sedentary occupied zone, a concentration of 800 to 1,000ppm typically represents a ventilation rate of about 10Ls1 per person. CIBSE Guide A7 notes that, as a general rule, the fresh air supply rate should not fall below between 5Ls1 and 8Ls1 per occupant, but this will depend on various other factors, including oor area per occupant, processes carried out, equipment used, and whether the work is strenuous. As a rule of thumb, 8Ls1 fresh air is equivalent to an elevation of 600ppm of CO2 that, when added to the normal outdoor CO2, gives an internal CO2 concentration of approximately 1,000ppm; 5Ls1 would be equivalent to 1,350ppm internally. However, CIBSE recommends higher values of 10Ls1 for comfort which includes consideration of other aspects of IAQ,such as other emissions from occupants known as bioeffluents. The UK statutory average exposure limit over an eight-hour reference period is a CO2 concentration of 5,000ppm in working conditions, with a 15-minute short-term exposure limit of 15,000ppm.8 CO2 concentration in indoor environments has long been used as an indicator of ventilation requirements and as a proxy for indoor air quality. The study9 undertaken by Allen, published in 2016, cited the increasingly airtight and energy efficient buildings as key in the increase in levels of internal CO2 and volatile organiccompounds (VOCs). Referring to US homes, he noted that infiltration rates had typically reduced from a traditional house with one air change per hour to 0.1-0.2 air changes per hour for modern homes. This decrease in the (normally) dilutingventilating action of the outdoor air can lead to increased concentration ofCO2 and indoor pollutants that contribute to the resulting challenges of sick building syndrome. In an example of the many UK investigations carried out in recent years, the Transport Energy supply Business Residential Agriculture Waste management Other Figure 3: CO2 production in UK 20175 64 March 2019 www.cibsejournal.com CIBSE Mar19 pp63-66 CPD.indd 64 22/02/2019 16:47