
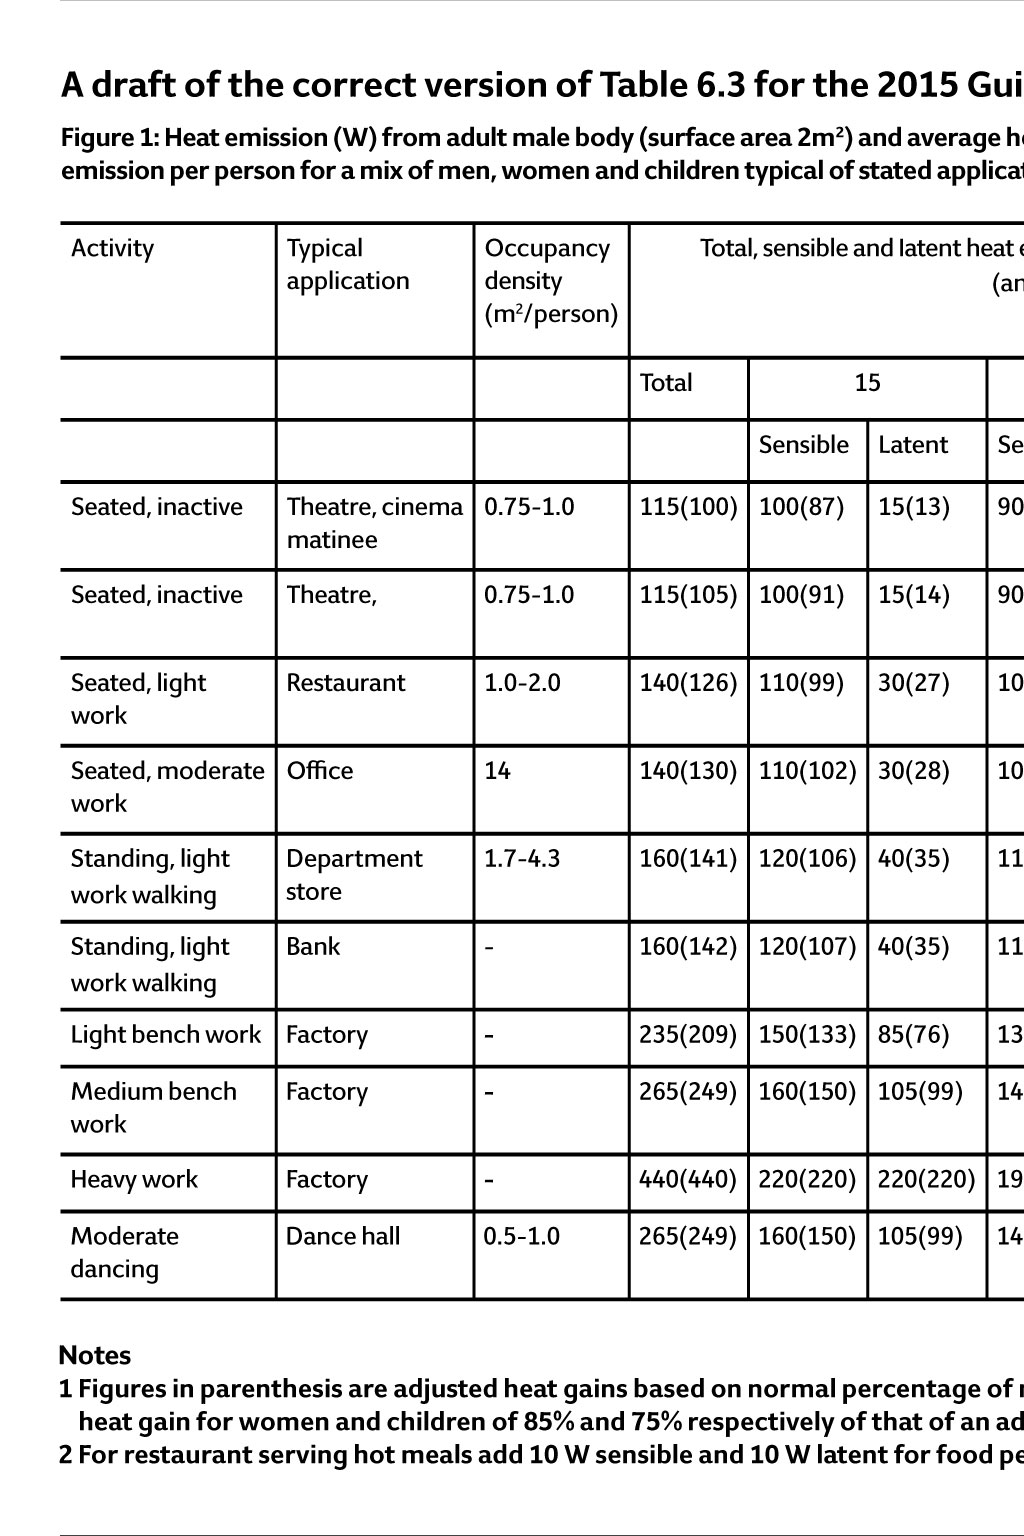
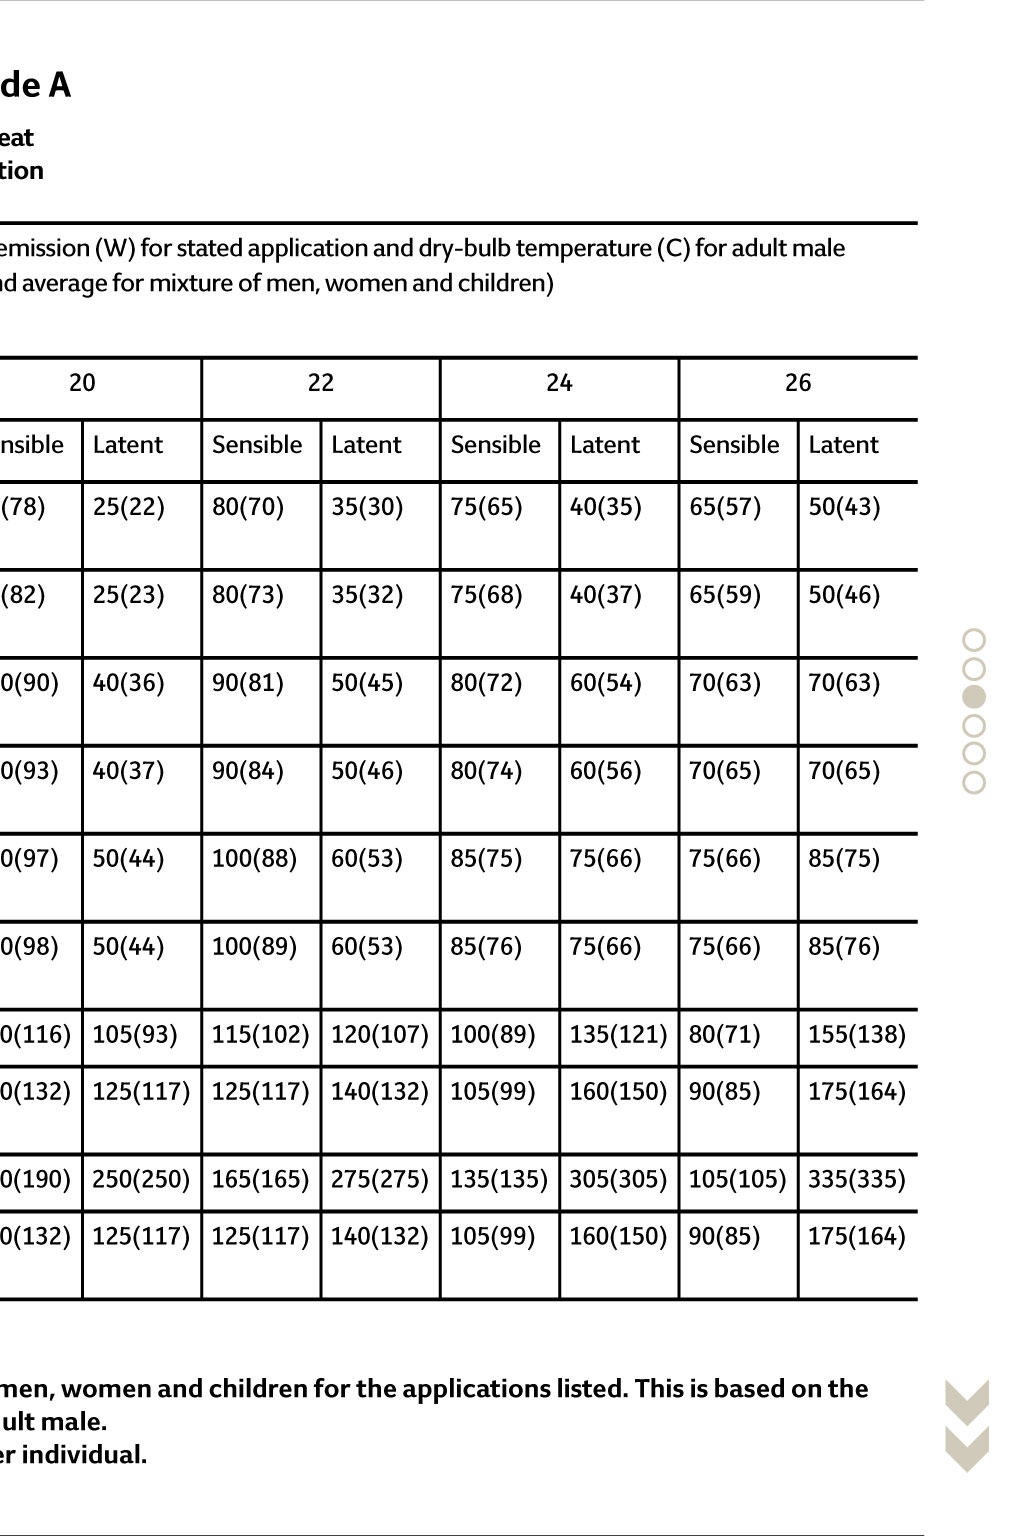
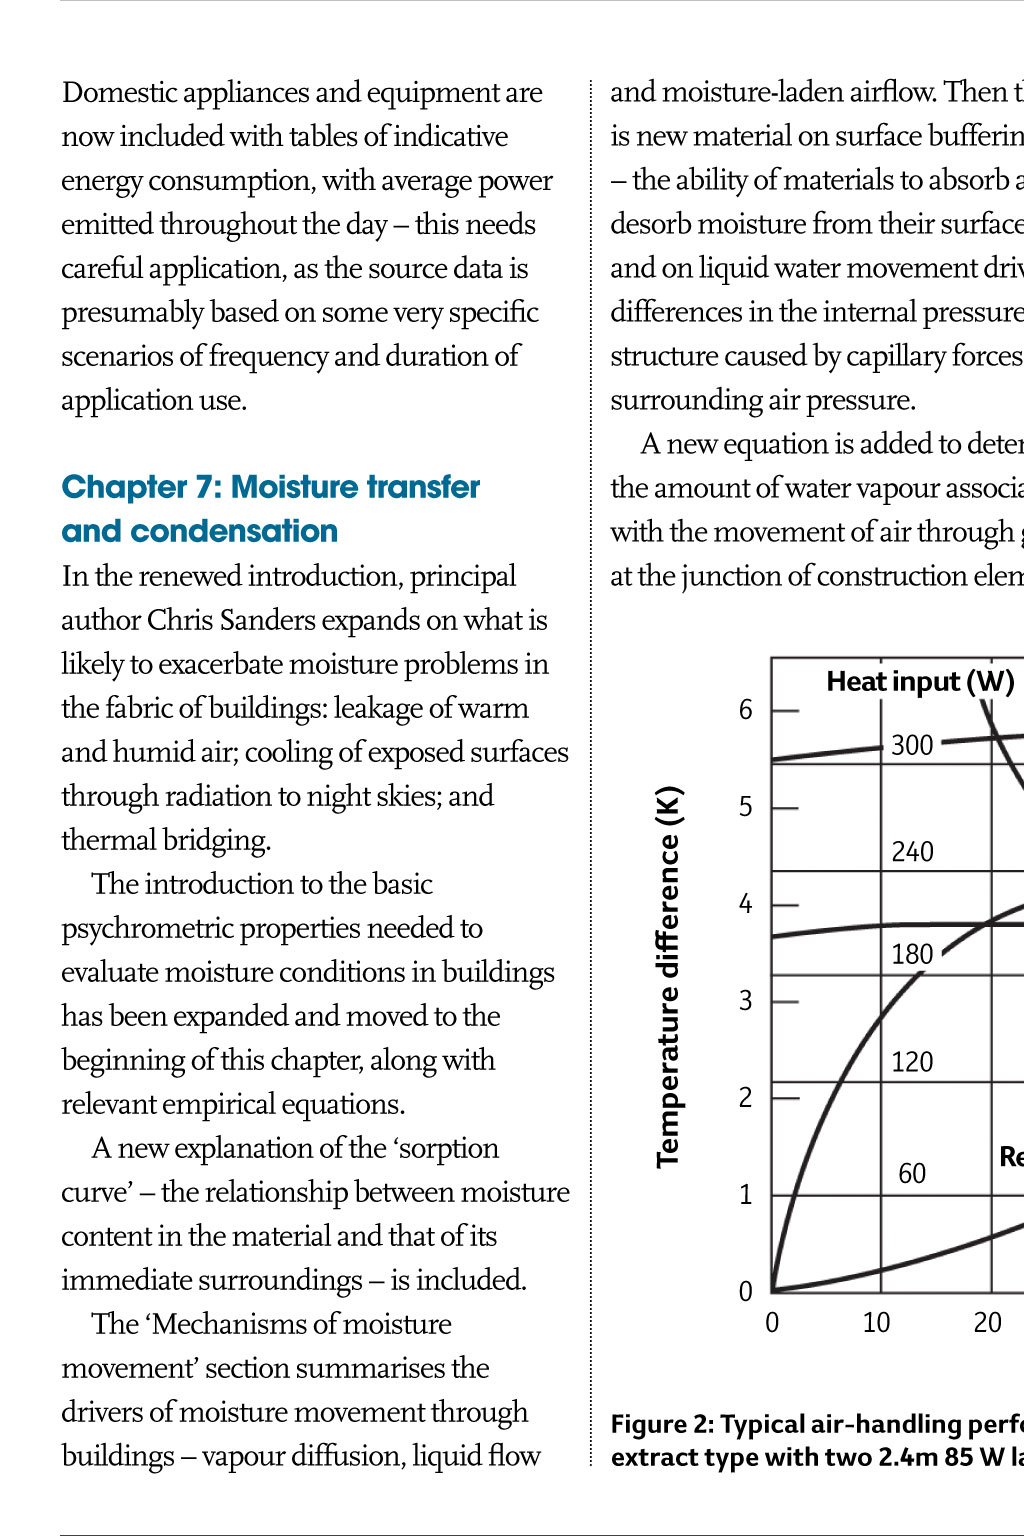
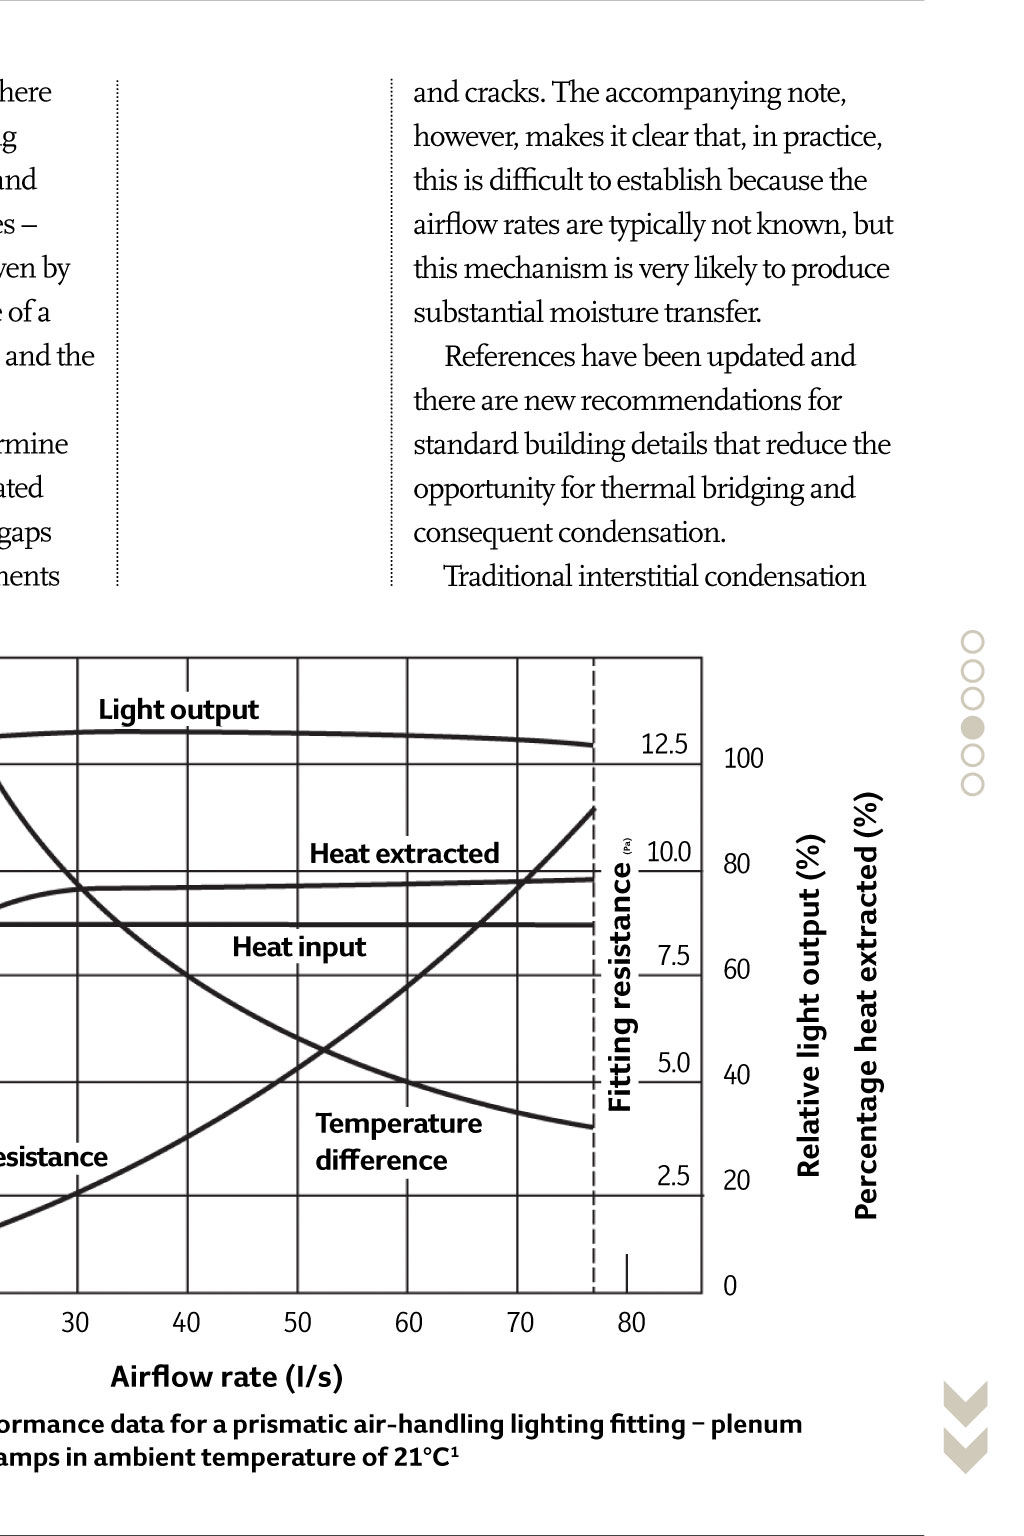
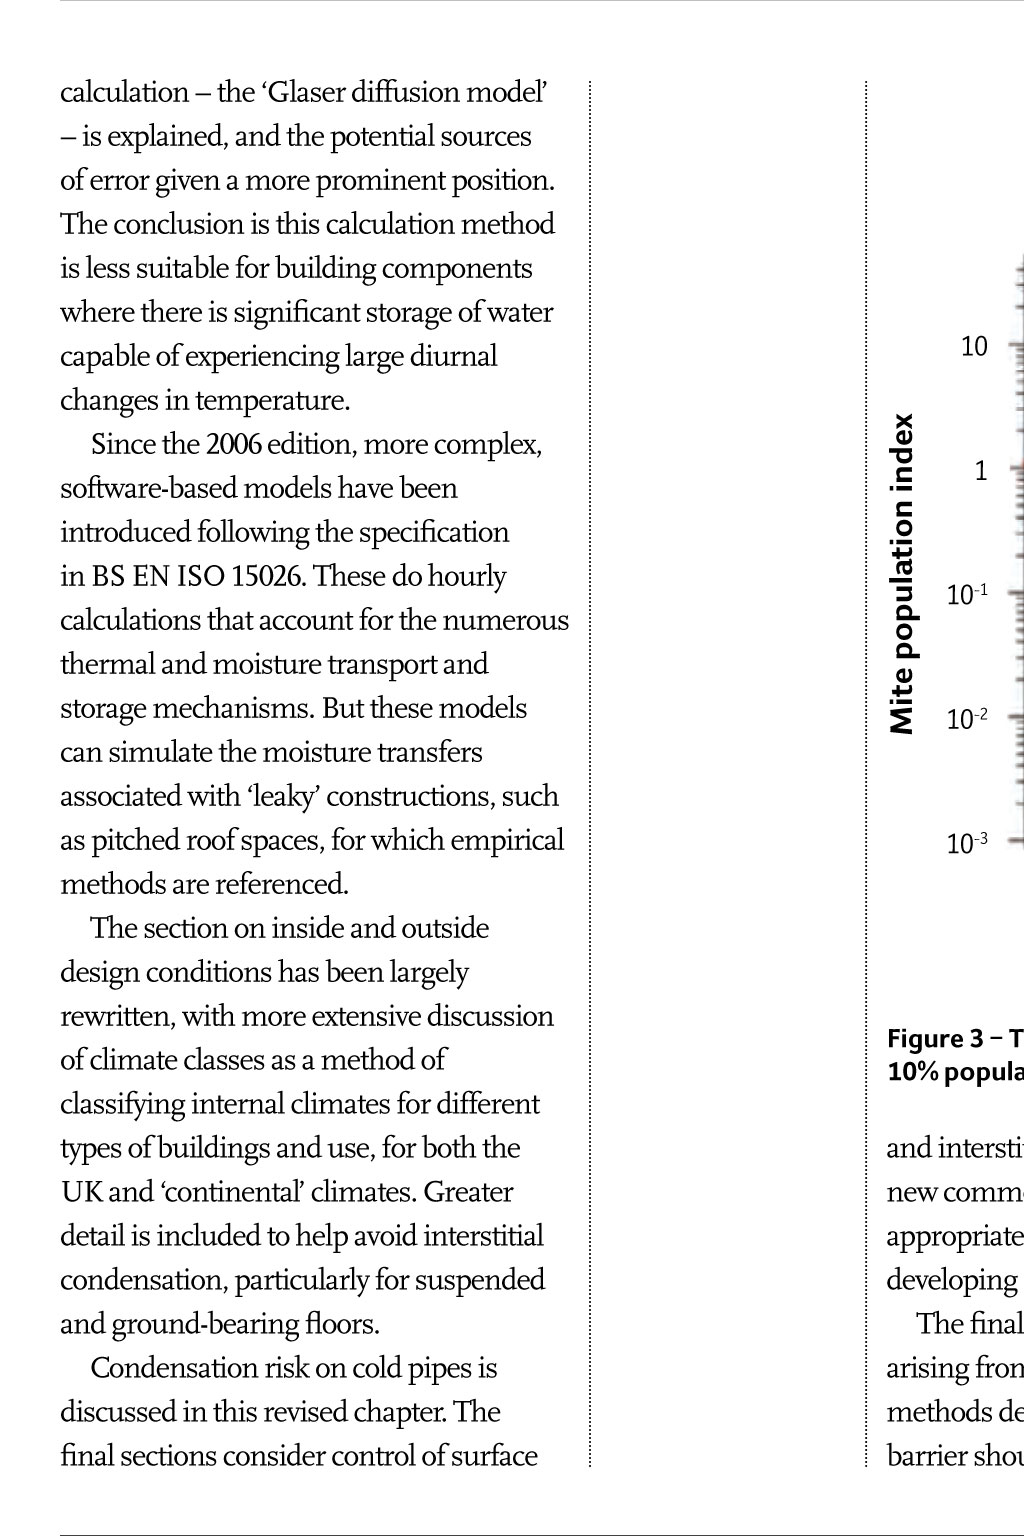
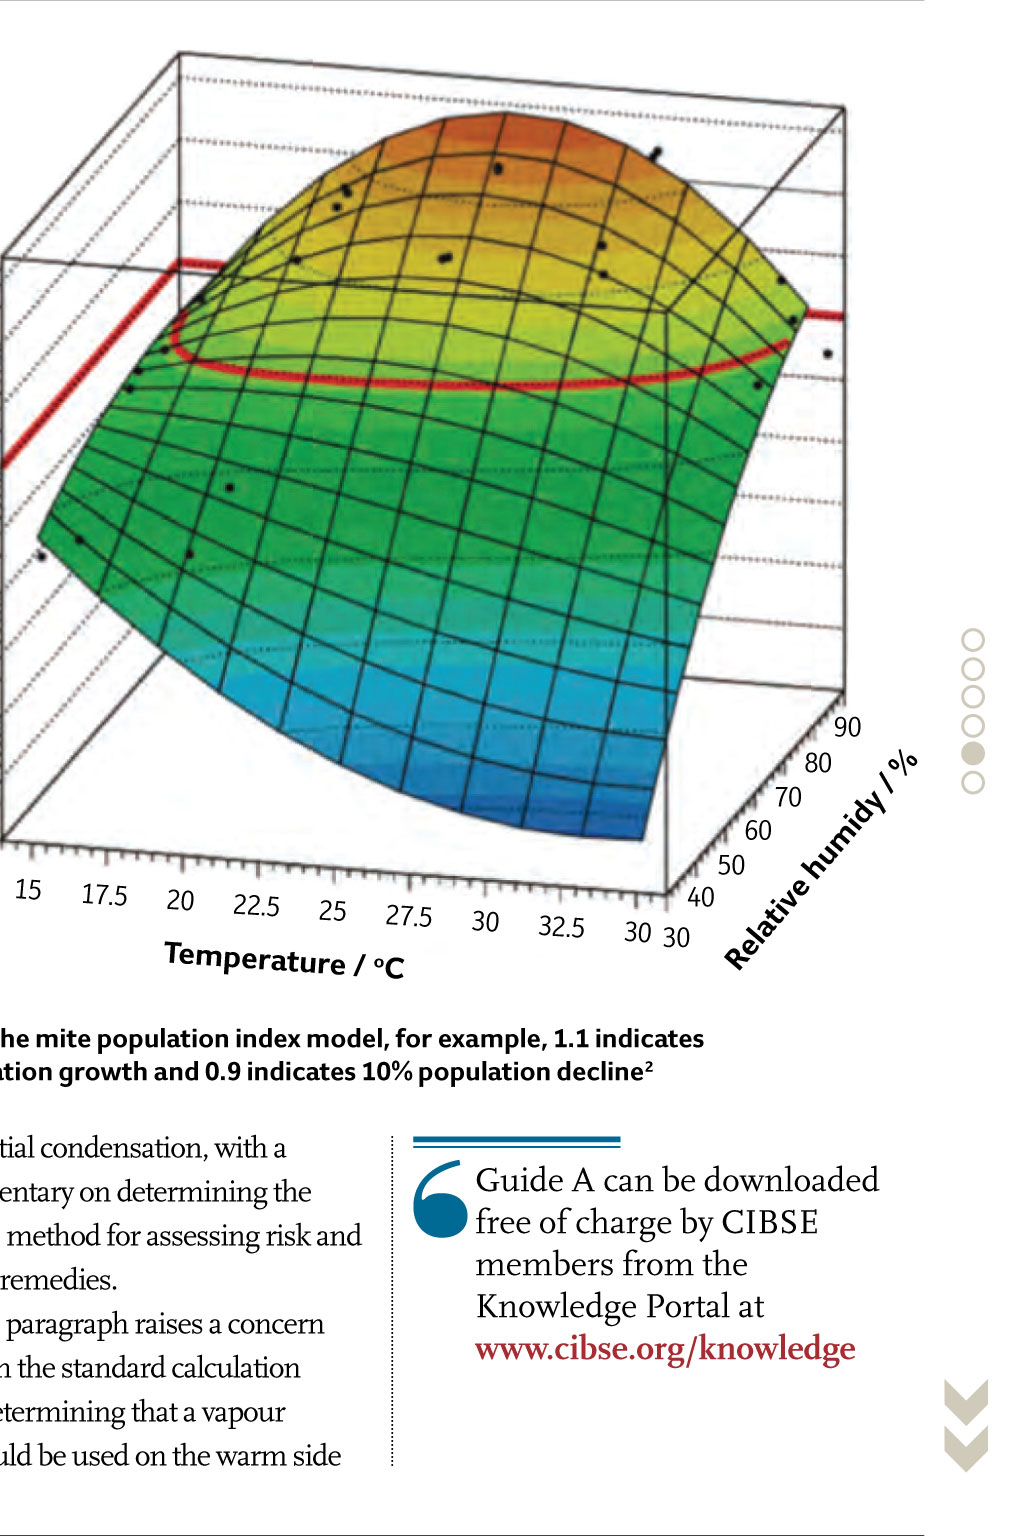


XXXXXX XXXXXX XXXXXXXXX CIBSEs essential guide to environmental design explained, Part three Important updates on internal heat gains, condensation, and indoor air quality are included in the new version of Guide A. Tim Dwyer concludes his series on this key document by drawing attention to the most significant changes in these areas T he CIBSE guide to Environmental design has had a major upgrade for the first time in nine years. This is the last of three articles that aim to provide an overview of the new Guide A. chapter 6: internal heat gains Principal author David Arnold starts the chapter with a subtle change to its introductory wording, with the broader term mechanical cooling used in place of air conditioning when referring to the way internal heat gains typically are removed from a space. This is, of course, noted alongside ventilation and other means (presumably referring to passive cooling and natural ventilation), but clearly indicates the increased application of comfort cooling (that is, the control of temperature while not maintaining a specific value of humidity), as opposed to traditional centralised full air conditioning. Benchmark values for internal heat gains have not altered since the previous edition, although the accompanying text notes the impact of the transition to LED lights is likely to reduce lighting gain by up to 50%. The equipment loads cited in that table have not altered in this revision. This could be explained by the development of computers since Guide A 2006. There have been increasing equipment loads in the intervening years from the application of desktop computers and so on which, because of improving technology and a reduction in heat emissions, have subsequently fallen back to levels assumed by the 2006 edition. Due to a glitch in the publishing process, the version of Table 6.3 that has been included in the published 2015 Guide A on typical heat emitted by humans is, erroneously, an updated version of the one used in the 2006 edition (as taken from the ASHRAE Fundamentals Handbook, 2013). Following (pre-publication) included lighting energy targets has been removed. This chapters rewrite has coincided with the more regular application of LED lighting. There is a short section reflecting this shift in technology, which is likely to have a more significant impact by the time this chapter is next revised. Updated data based on research published in 2011 is given for office equipment such as computers and laser printers; however, it is unlikely that this is wholly representative of current equipment. A brief discussion on office television displays is now included, indicating that although the Energy Star requirements set a maximum power of 108W heat output from some large flat-panel, plasma TVs has exceeded 500 W. Commercial cooking appliances have a refreshed set of tables drawn from the ASHRAE Fundamentals Handbook, but some may struggle to apply the data if they are unfamiliar with North American terminology and application. New heat-gain tables have been added to the section on hospital and laboratory equipment. feedback from CIBSE reviewers, it was decided that Table 6.3 should revert to the style and content of that used in the pre2006 editions of the Guide. The correct version is shown in Figure 1 and this will be incorporated in the updated Guide A 2015 editions. A newly added note to this table indicates the original source of the data is unknown but the figures represent custom and practice and are deemed suitable for practical use in the UK and other temperate climates. When considering the gain from lighting, the effect of the optics, casing and mounting of the luminaire as well as the proportions of the radiant, conductive and convective components are highlighted as being significant to the space heat gain. Information reporting on the performance of luminaires is presented as in the example of Figure 2, which indicates the effect of airflow rate on the heat gain through an air-handling luminaire. A subsequent note includes a brief discussion on the effect of airflow on the (radiative/convective) mode of the gain. The table that previously A draft of the correct version of Table 6.3 for the 2015 Guide A Figure 1: Heat emission (W) from adult male body (surface area 2m2) and average heat emission per person for a mix of men, women and children typical of stated application Activity Typical application Occupancy density (m2/person) Total, sensible and Iatent heat emission (W) for stated application and dry-bulb temperature (C) for adult male (and average for mixture of men, women and children) Total 15 20 22 24 26 Sensible Latent Sensible Latent Sensible Latent Sensible Latent Sensible Latent Seated, inactive Theatre, cinema 0.75-1.0 matinee 115(100) 100(87) 15(13) 90(78) 25(22) 80(70) 35(30) 75(65) 40(35) 65(57) 50(43) Seated, inactive Theatre, 0.75-1.0 115(105) 100(91) 15(14) 90(82) 25(23) 80(73) 35(32) 75(68) 40(37) 65(59) 50(46) Seated, light work Restaurant 1.0-2.0 140(126) 110(99) 30(27) 100(90) 40(36) 90(81) 50(45) 80(72) 60(54) 70(63) 70(63) Seated, moderate Office work 14 140(130) 110(102) 30(28) 100(93) 40(37) 90(84) 50(46) 80(74) 60(56) 70(65) 70(65) Standing, light work walking Department store 1.7-4.3 160(141) 120(106) 40(35) 110(97) 50(44) 100(88) 60(53) 85(75) 75(66) 75(66) 85(75) Standing, light work walking Bank - 160(142) 120(107) 40(35) 110(98) 50(44) 100(89) 60(53) 85(76) 75(66) 75(66) 85(76) Light bench work Factory - 235(209) 150(133) 85(76) 130(116) 105(93) 115(102) 120(107) 100(89) 135(121) 80(71) 155(138) Medium bench work Factory - 265(249) 160(150) 105(99) 140(132) 125(117) 125(117) 140(132) 105(99) 160(150) 90(85) 175(164) Heavy work Factory - 440(440) 220(220) 220(220) 190(190) 250(250) 165(165) 275(275) 135(135) 305(305) 105(105) 335(335) Moderate dancing Dance hall 0.5-1.0 265(249) 160(150) 105(99) 140(132) 125(117) 125(117) 140(132) 105(99) 160(150) 90(85) 175(164) Notes 1 Figures in parenthesis are adjusted heat gains based on normal percentage of men, women and children for the applications listed. This is based on the heat gain for women and children of 85% and 75% respectively of that of an adult male. 2 For restaurant serving hot meals add 10 W sensible and 10 W latent for food per individual. of an internally insulated solid masonry wall, as would frequently be used in the refurbishment of traditional buildings. This can cause problems by impeding the mechanisms that allow evaporation of water that has been absorbed at the external face of the wall into the outside air. chapter 8: health issues Principal author Marialena Nikolopoulou has re-ordered this chapter and practically all sections have been revised to include material supported by recent research on health issues. More extensive discussions, including new charts examining the risk of burns, and scalds, has been moved to a later (new) section on water services. The text on high humidity includes more on reducing house dust mites (HDM) by regulating temperature and humidity. The mite population index model (see Figure 3) provides empirical results for HDM population growth at varying temperature and humidity combinations. Lower humidities not only deter HDM, but as a newly introduced comment indicates indoor air quality (IAQ) is likely to be perceived as being better at lower relative humidities. A key factor for IAQ the per person fresh air supply rate includes a variation to previous editions; 6 and cracks. The accompanying note, however, makes it clear that, in practice, this is difficult to establish because the airflow rates are typically not known, but this mechanism is very likely to produce substantial moisture transfer. References have been updated and there are new recommendations for standard building details that reduce the opportunity for thermal bridging and consequent condensation. Traditional interstitial condensation Light output 12.5 100 10.0 80 7.5 60 5.0 40 2.5 300 20 Fitting resistance (Pa) Heat extracted 4 Heat input 180 3 120 2 0 Resistance 60 1 Temperature difference Relative light output (%) 240 Percentage heat extracted (%) 5 0 0 10 20 30 40 50 60 70 80 Airflow rate (I/s) Figure 2: Typical air-handling performance data for a prismatic air-handling lighting fitting plenum extract type with two 2.4m 85 W lamps in ambient temperature of 21C1 10 1 10-1 10-2 90 15 17.5 20 22.5 25 27.5 Temperature / o C 30 32.5 40 30 30 y id 60 50 hu m 10 -3 70 /% 80 Re la tiv e calculation the Glaser diffusion model is explained, and the potential sources of error given a more prominent position. The conclusion is this calculation method is less suitable for building components where there is significant storage of water capable of experiencing large diurnal changes in temperature. Since the 2006 edition, more complex, software-based models have been introduced following the specification in BS EN ISO 15026. These do hourly calculations that account for the numerous thermal and moisture transport and storage mechanisms. But these models can simulate the moisture transfers associated with leaky constructions, such as pitched roof spaces, for which empirical methods are referenced. The section on inside and outside design conditions has been largely rewritten, with more extensive discussion of climate classes as a method of classifying internal climates for different types of buildings and use, for both the UK and continental climates. Greater detail is included to help avoid interstitial condensation, particularly for suspended and ground-bearing floors. Condensation risk on cold pipes is discussed in this revised chapter. The final sections consider control of surface Heat input (W) Mite population index chapter 7: Moisture transfer and condensation In the renewed introduction, principal author Chris Sanders expands on what is likely to exacerbate moisture problems in the fabric of buildings: leakage of warm and humid air; cooling of exposed surfaces through radiation to night skies; and thermal bridging. The introduction to the basic psychrometric properties needed to evaluate moisture conditions in buildings has been expanded and moved to the beginning of this chapter, along with relevant empirical equations. A new explanation of the sorption curve the relationship between moisture content in the material and that of its immediate surroundings is included. The Mechanisms of moisture movement section summarises the drivers of moisture movement through buildings vapour diffusion, liquid flow and moisture-laden airflow. Then there is new material on surface buffering the ability of materials to absorb and desorb moisture from their surfaces and on liquid water movement driven by differences in the internal pressure of a structure caused by capillary forces and the surrounding air pressure. A new equation is added to determine the amount of water vapour associated with the movement of air through gaps at the junction of construction elements Temperature difference (K) Domestic appliances and equipment are now included with tables of indicative energy consumption, with average power emitted throughout the day this needs careful application, as the source data is presumably based on some very specific scenarios of frequency and duration of application use. Figure 3 The mite population index model, for example, 1.1 indicates 10% population growth and 0.9 indicates 10% population decline2 and interstitial condensation, with a new commentary on determining the appropriate method for assessing risk and developing remedies. The final paragraph raises a concern arising from the standard calculation methods determining that a vapour barrier should be used on the warm side as well as the UK HSE guidance of 8Ls-1 being cited a note has been introduced explicitly saying that CIBSE recommends higher values of 10Ls-1 for comfort. The section on the health effects of common indoor pollutants has been expanded. Microbiological contamination of the ventilation paths is highlighted through examples such as the Sars severe acute respiratory syndrome outbreak. The sick building syndrome discussion has been extended and, at the end of section Air quality and ventilation, new paragraphs consider the interaction of environment with productivity. The section on visual environment has been clarified and extended, with a summary of the four classes used to describe the health effects of light: by radiation; through the visual system; through the circadian system; and acting as a purifier. There is a new section on the application of ultra violet germicidal irradiation (UVGI) in building air applications, including safety and maintenance factors. A section on water quality gives an overview of the health and safety aspects of cold, potable and hot water services, and discussing Legionnaires disease and scalds. The material on static electricity, meanwhile, has been expanded to more Guide A can be downloaded free of charge by CIBSE members from the Knowledge Portal at www.cibse.org/knowledge fully explain the cause of static problems for building occupants. The section Noise and vibration has been rewritten and now includes a paragraph on the acoustic requirements of health facilities. Finally, the health impact assessment (HIA) concept is introduced, acknowledging that health and wellbeing are determined by many environmental and socio-economic factors. about the authors Tim Dwyer FCIBSE, technical editor at CIBSE Journal; Marialena Nikolopoulou, director at CASE Research Centre at the University of Kent; David Arnold FCIBSE, partner at Troup Bywaters & Anders, and visiting professor at London South Bank University; Chris Sanders, director of Research on Indoor Climate and Health at Glasgow Caledonian University. cJ References 1 CIBSE Guide A 2015, Chapter 6, taken from Bedocs and Hewitt, 1970 2 CIBSE Guide A 2015, Chapter 8 taken from Crowther et al, Experimental and Applied Acarology 39, 2006] See also Guide A Part one and Guide A Part two by Tim Dwyer