


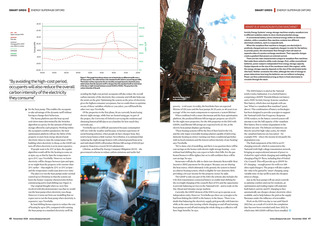
SMART GRIDS | ENERGY SUPERHUB OXFORD 0.35 500.00 0.30 Agile cost per kWh Cost per kWh SAP2010 SAP2012 0.20 300.0 0.15 gCO2 .kWh-1 Average gCO2 .kWh-1 over 24hrs in winter 400.0 0.25 Flat rate 200.0 0.10 100.0 0.05 0.00 00:00 0.0 03:00 06:00 By avoiding the high-cost period, occupants will also reduce the overall carbon intensity of the electricity they consume for the heat pump. This enables the occupants to take advantage of the dynamic tariff without having to change their behaviour. The Kensa platform uses the heat-up and cool-down times determined by the Switchee algorithm as a proxy for the amount of thermal storage offered by each property. Working within the occupants comfort parameters, the heat optimisation platform will use the fabric of the property to store heat energy ahead of peak electricity times to raise the temperature of the building when electricity is cheap, so the GSHP can turn off when electricity is at its most expensive. If people want to be 21oC at 5pm, the regular algorithm would call for the heating to come on at 4pm, say, so that by 5pm the temperature is up to 21oC, says Trewhella. However, we know electricity will be cheaper between 1pm and 4pm, so we might heat the property to be warmer than 21oC earlier that might be 22oC or 23oC at 5pm and the temperature could coast down over time. The plan is to run the heat pumps under normal control up to Christmas so that the system can learn the homes response characteristics before commencing active load shifting (see Figure 1). Our original thought when we were first involved with this demonstrator was that we would run the heat pump when electricity was cheap. However, it turns out from our modelling that we expect not to run the heat pump when electricity is expensive, says Trewhella. By load shifting Kensa expects to reduce the cost of heating by up to 25%, compared with running the heat pump on a standard electricity tariff. By 09:00 12:00 15:00 18:00 21:00 23:00 Figure 1: This graph from Kensa shows cost of electricity on different tariffs over a 24-hour period. The solid red line is the standard tariff, which is around 16p per kWh. The broken red line represents the six-monthly averaged dynamic electricity price, which shows that the dynamic tariff is cheaper than the standard tariff at most times of the day or night (except between around 15:30 to 19:00). The grey line is the carbon intensity of the grid avoiding the high-cost period, occupants will also reduce the overall carbon intensity of the electricity they consume and will also help ease the strain on the grid. Optimising the system on the price of electricity gives the highest consumer acceptance, but we could chose to optimise on any of these variables; whichever you select, you will benefit the other two, says Trewhella. Of the properties in the first phase, 56 are currently heated using electric night storage, while four are heated using gas. As part of the project, the University of Oxford is surveying the residents and obtaining historical bill data to set a baseline for how much they currently pay. Trewhella says its a difficult assessment because consumption will vary with the weather and because, in Kensas experience of social housing schemes, when people do have cheaper heat, they tend to keep homes a little warmer. Nevertheless, it is estimated that replacing the night storage heaters with a shared ground loop array and individual GSHPs will produce lifetime bill savings of 19,225 per property (based on a recent ECO3 submission). Lifetime, as defined by Energy Company Obligation (ECO) the governments scheme to reduce carbon emissions and tackle fuel Electric vehicle charging infrastructure will be an integral part of the ESO project 40 November 2020 www.cibsejournal.com CIBSE Nov20 pp38-41 ESO Battery.indd 40 23/10/2020 16:28