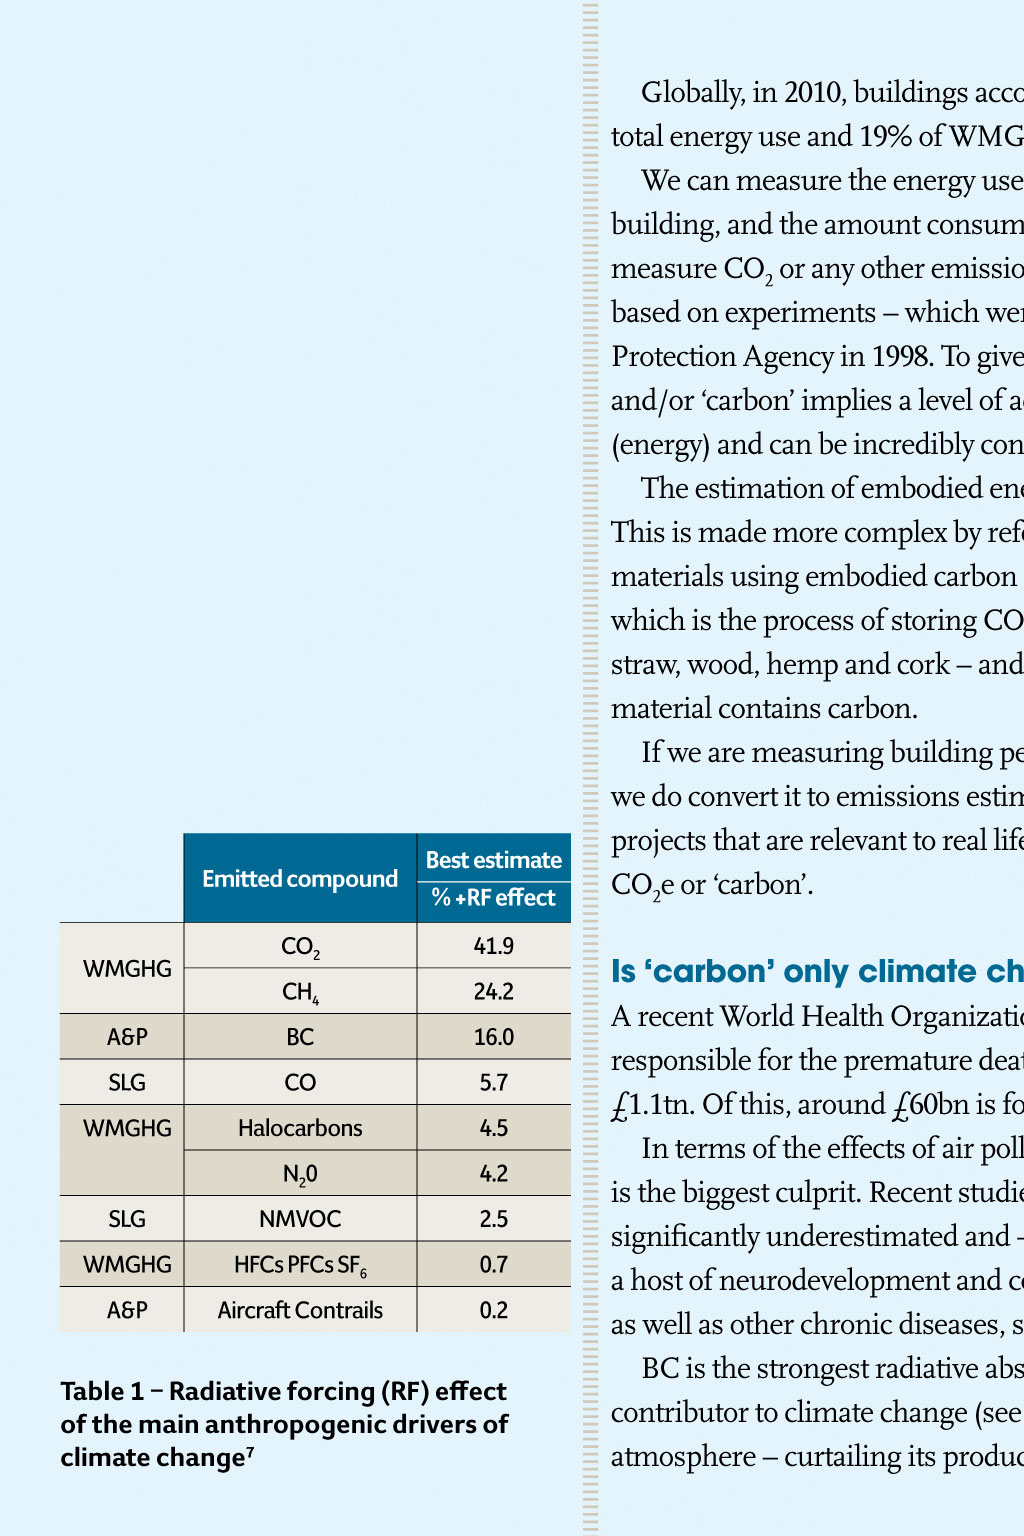
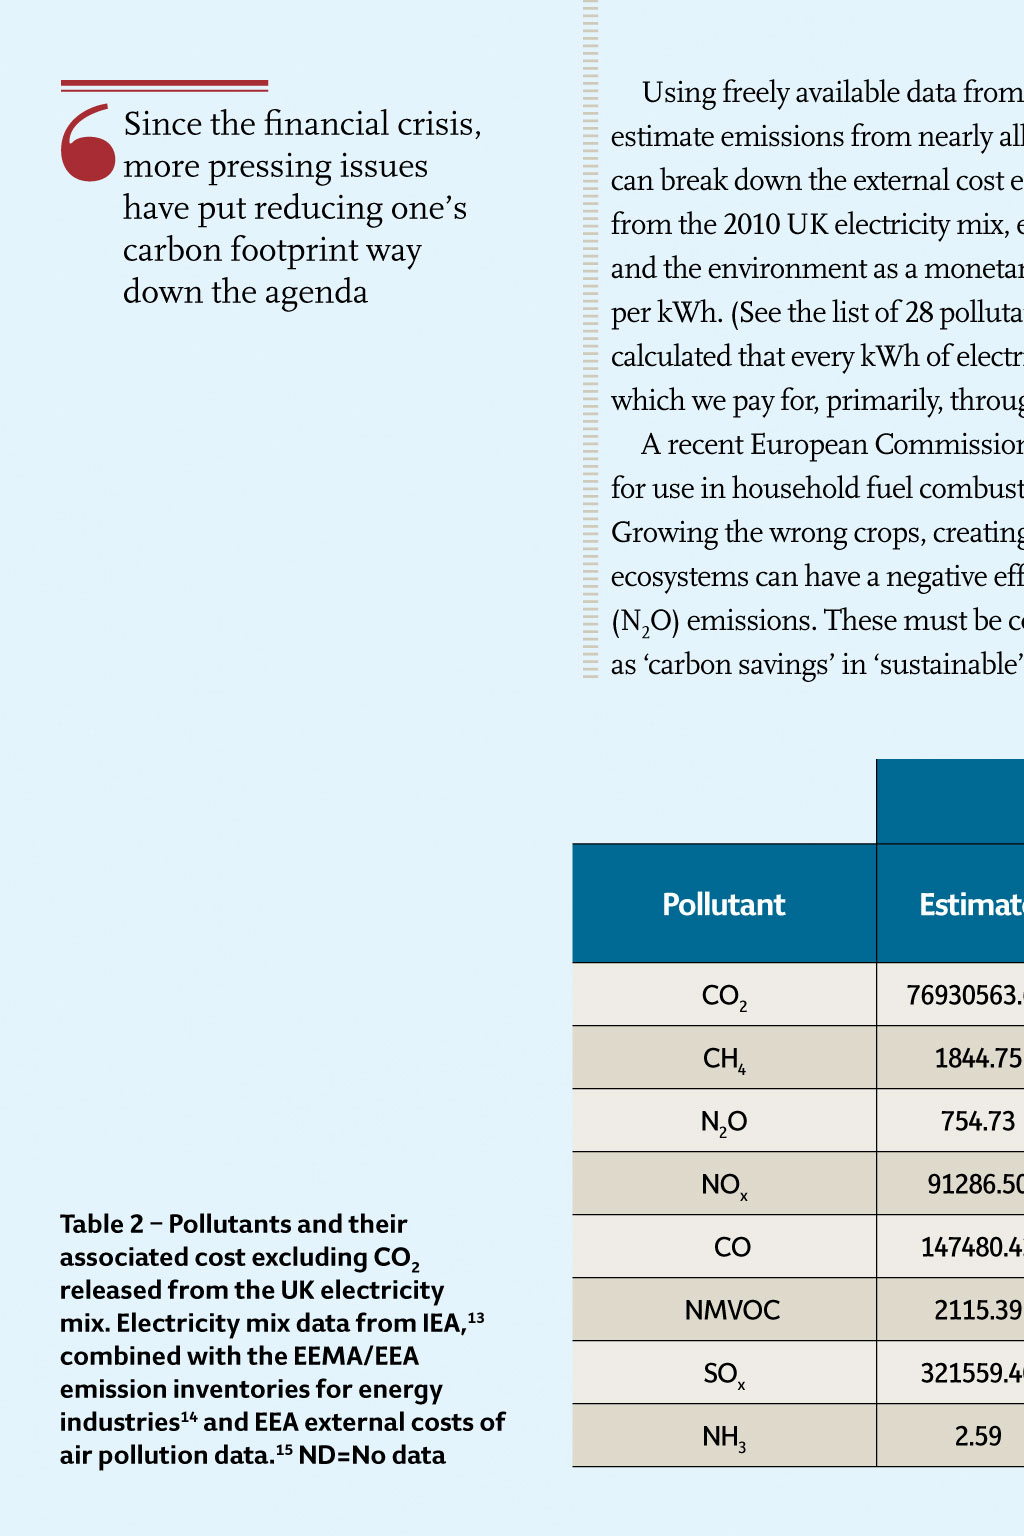
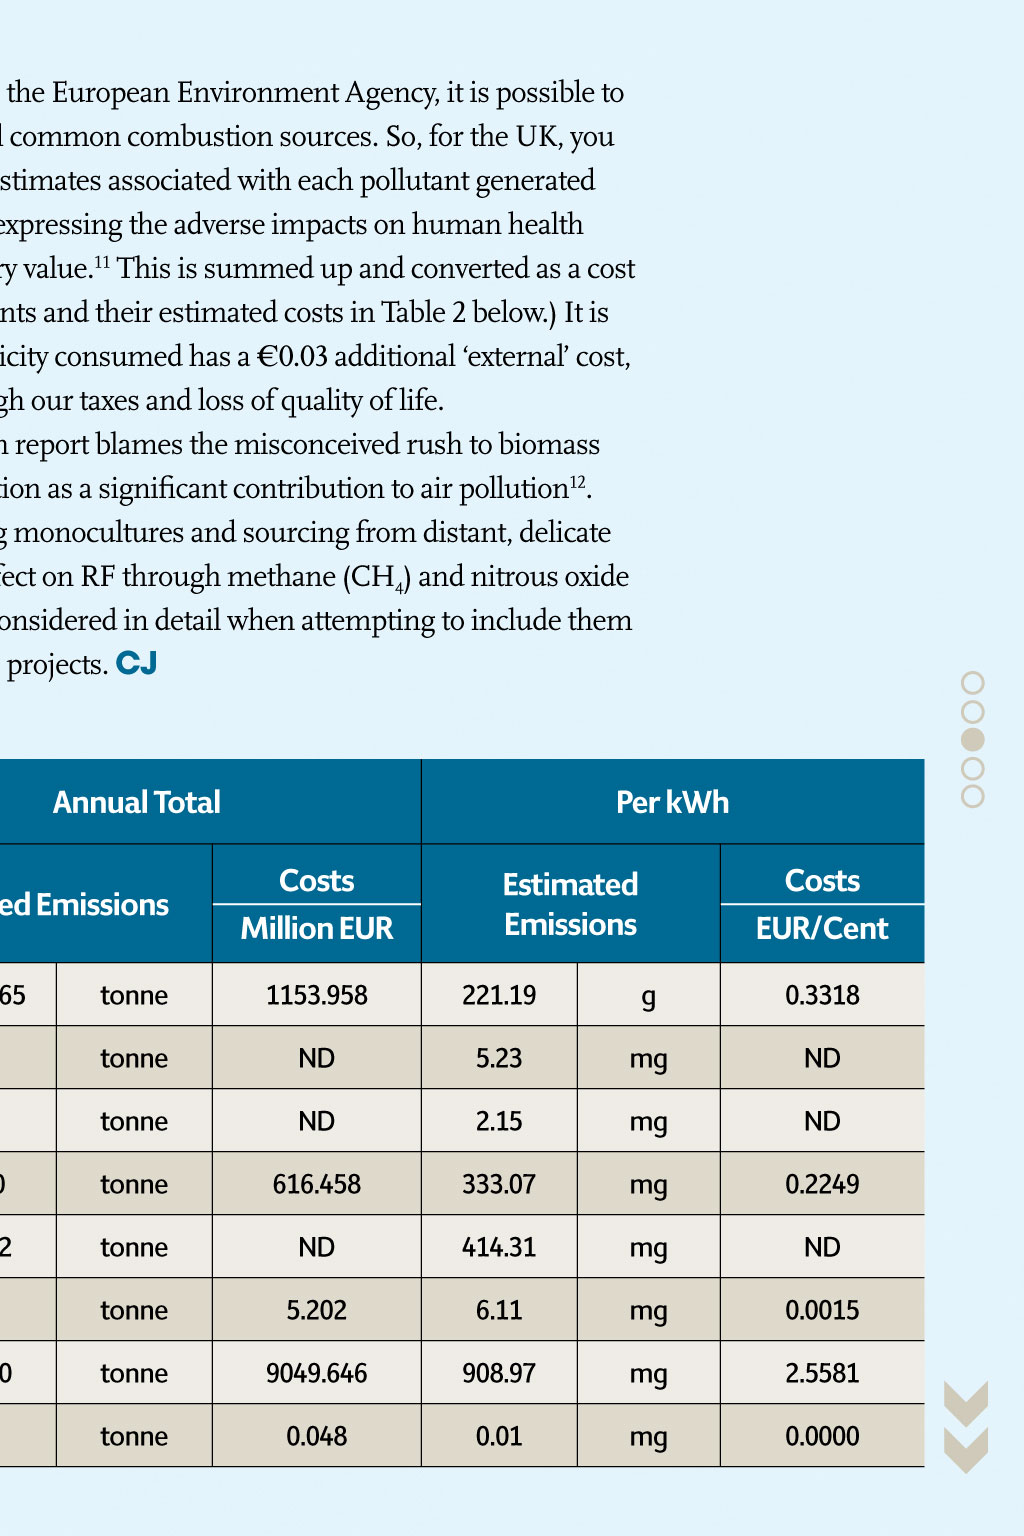
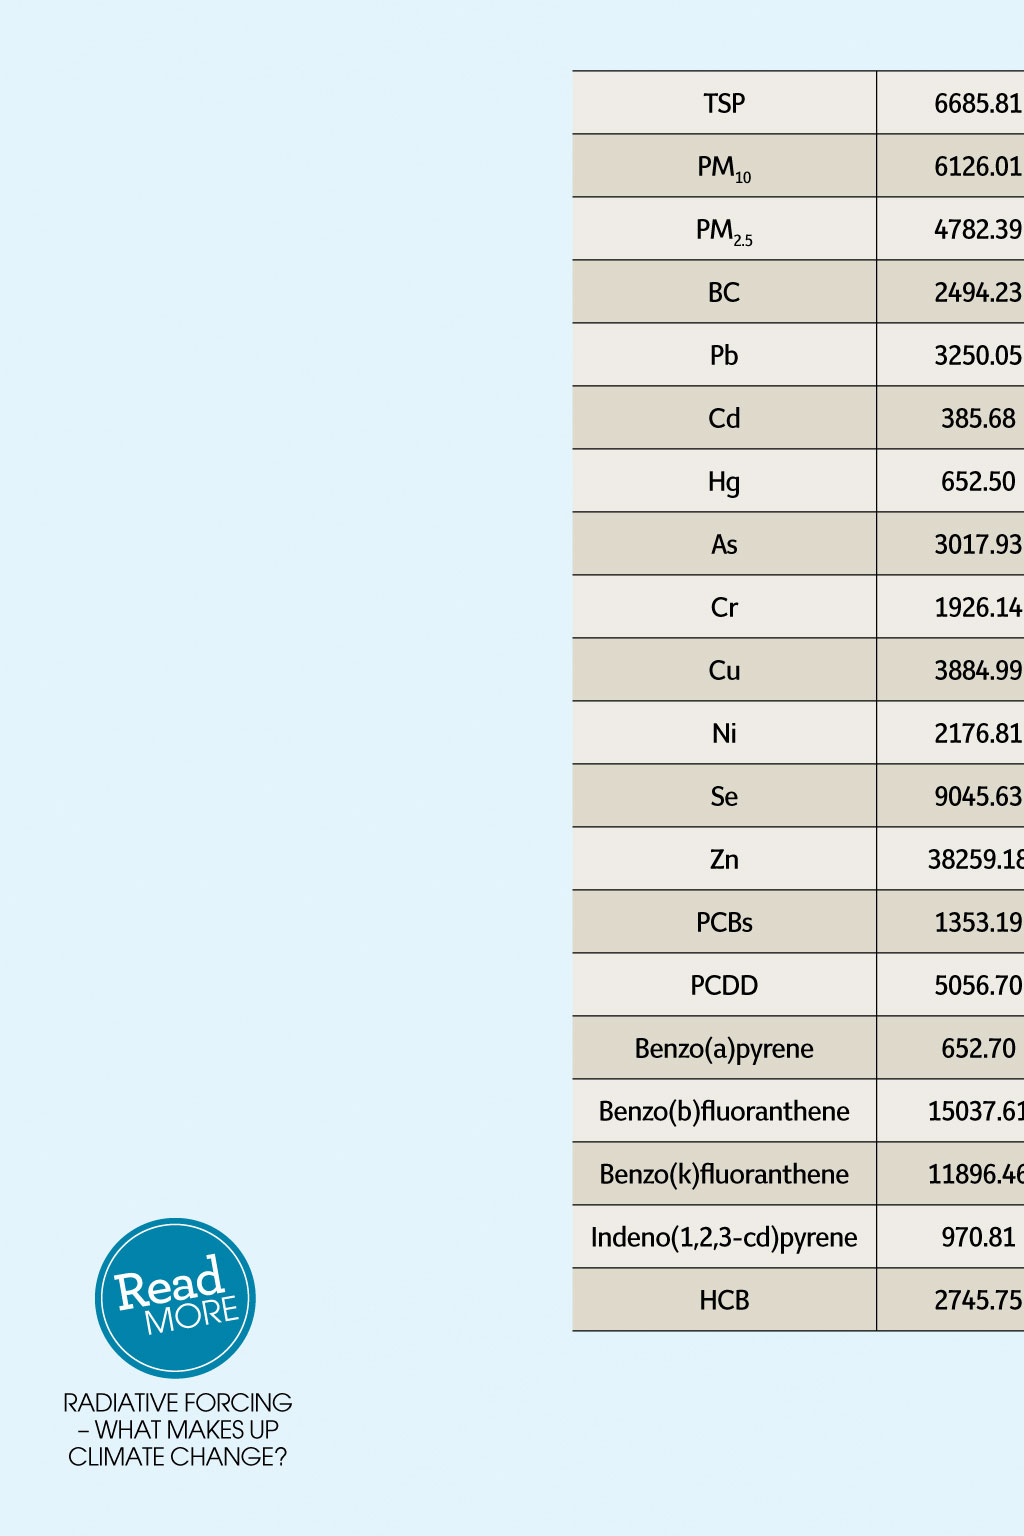
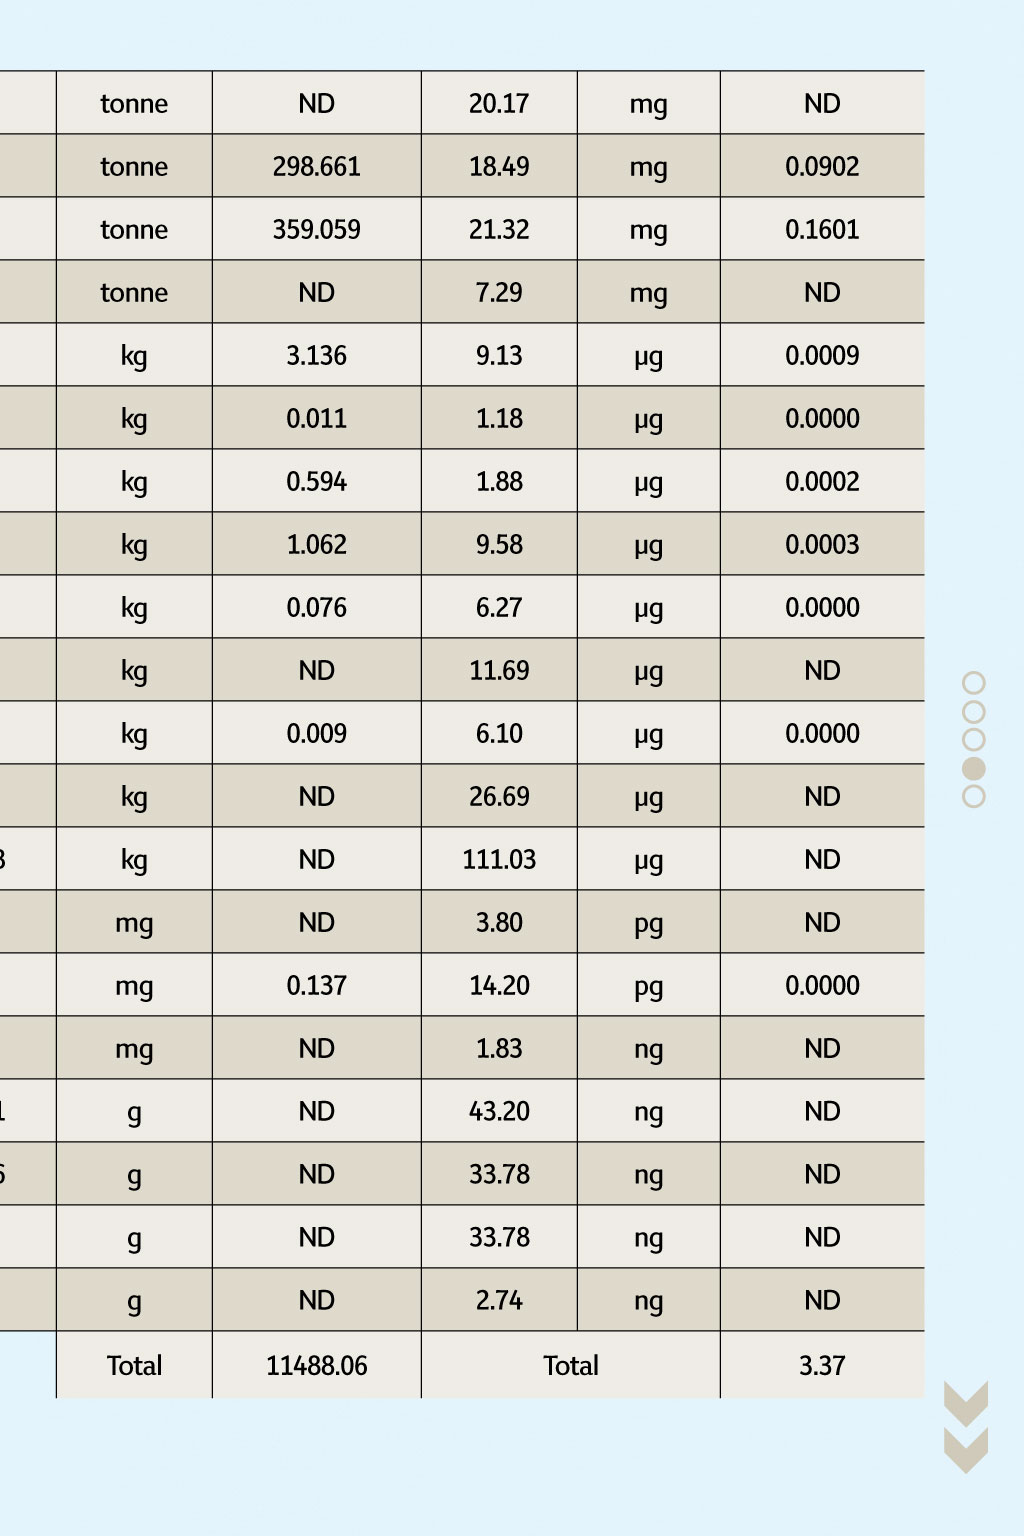
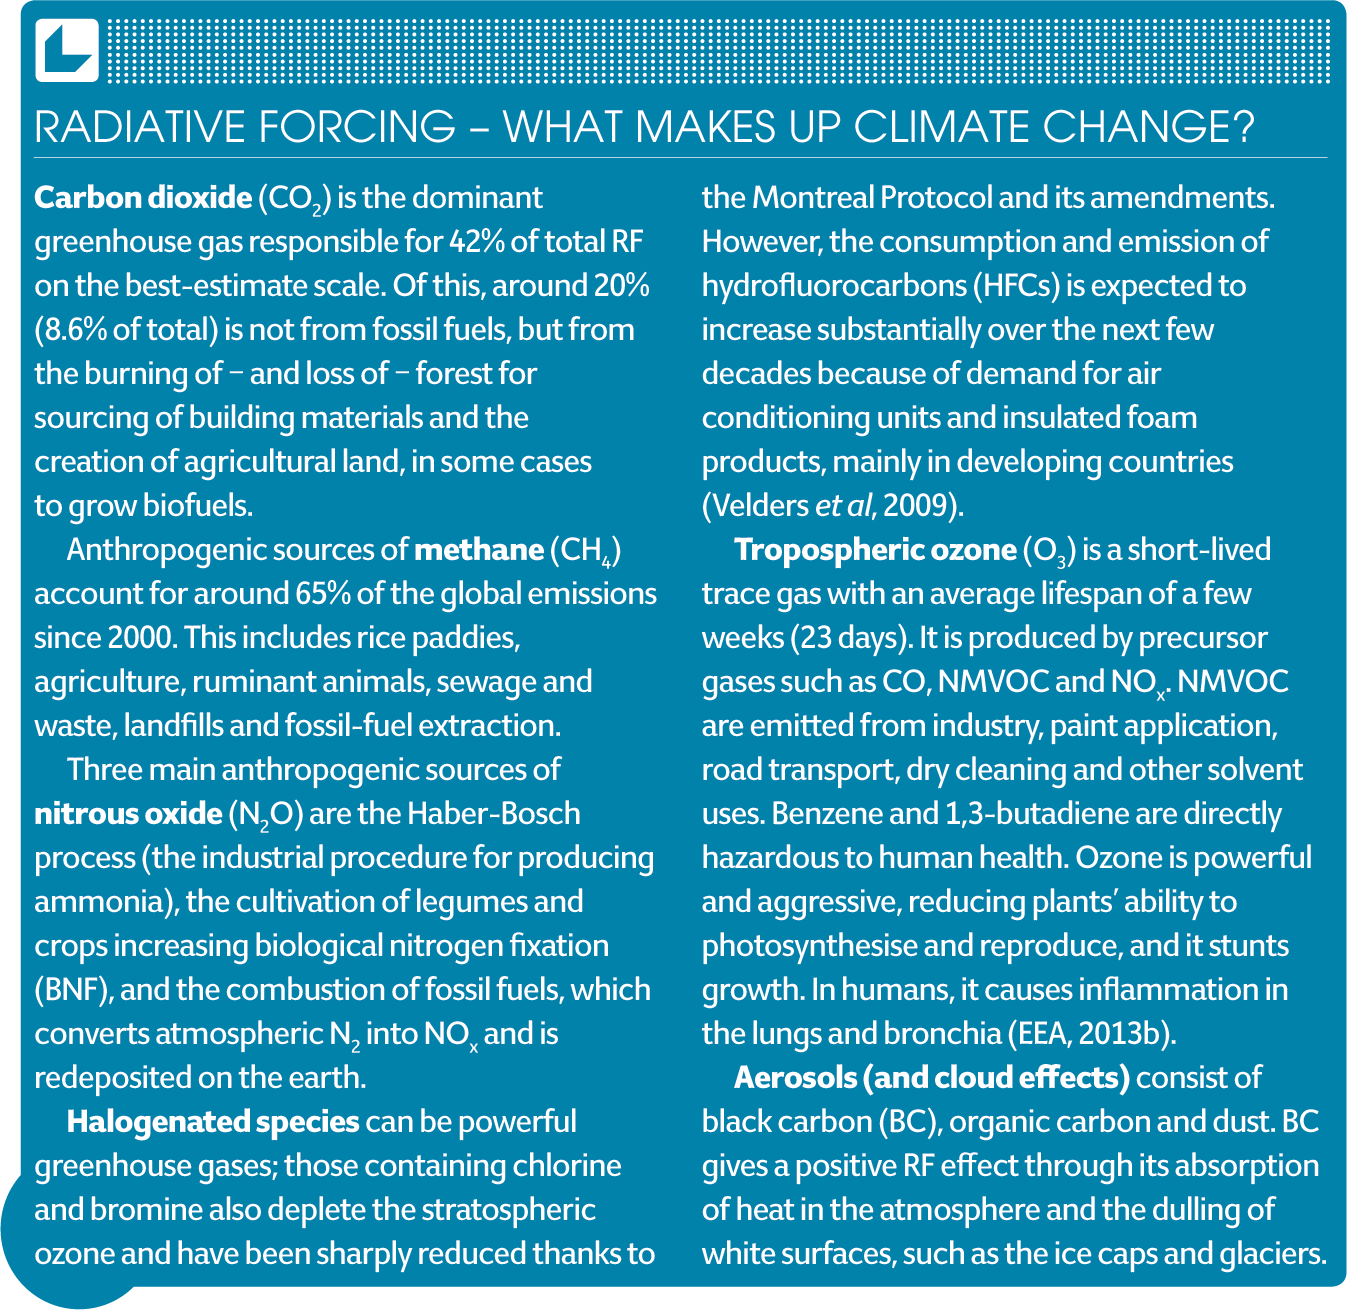
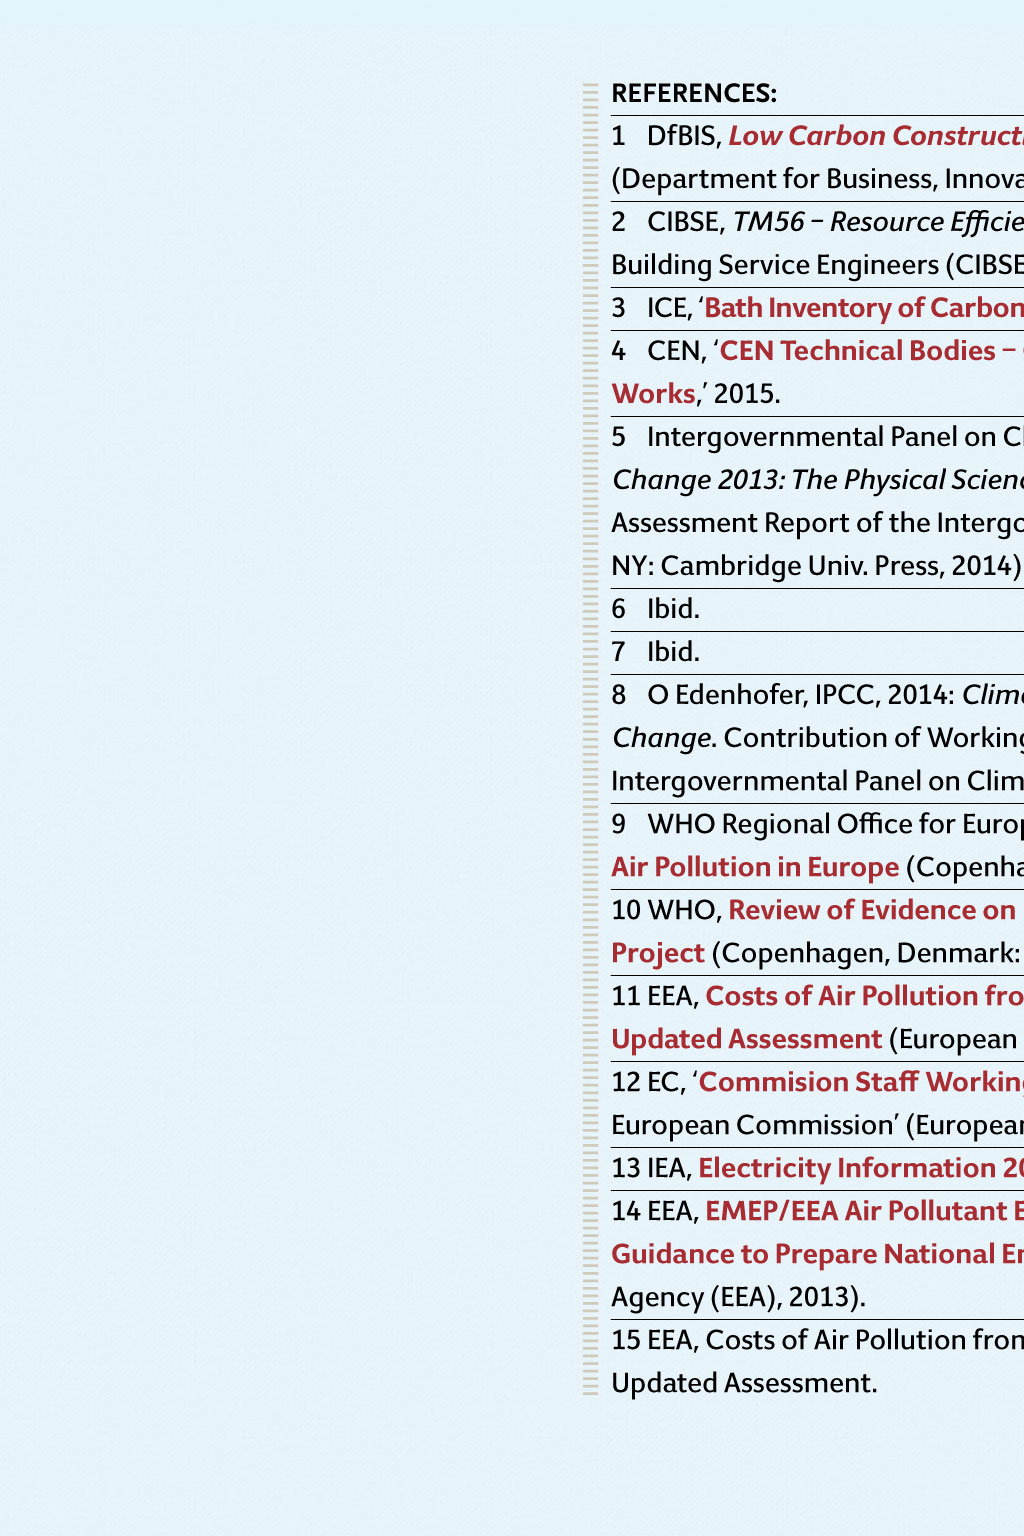
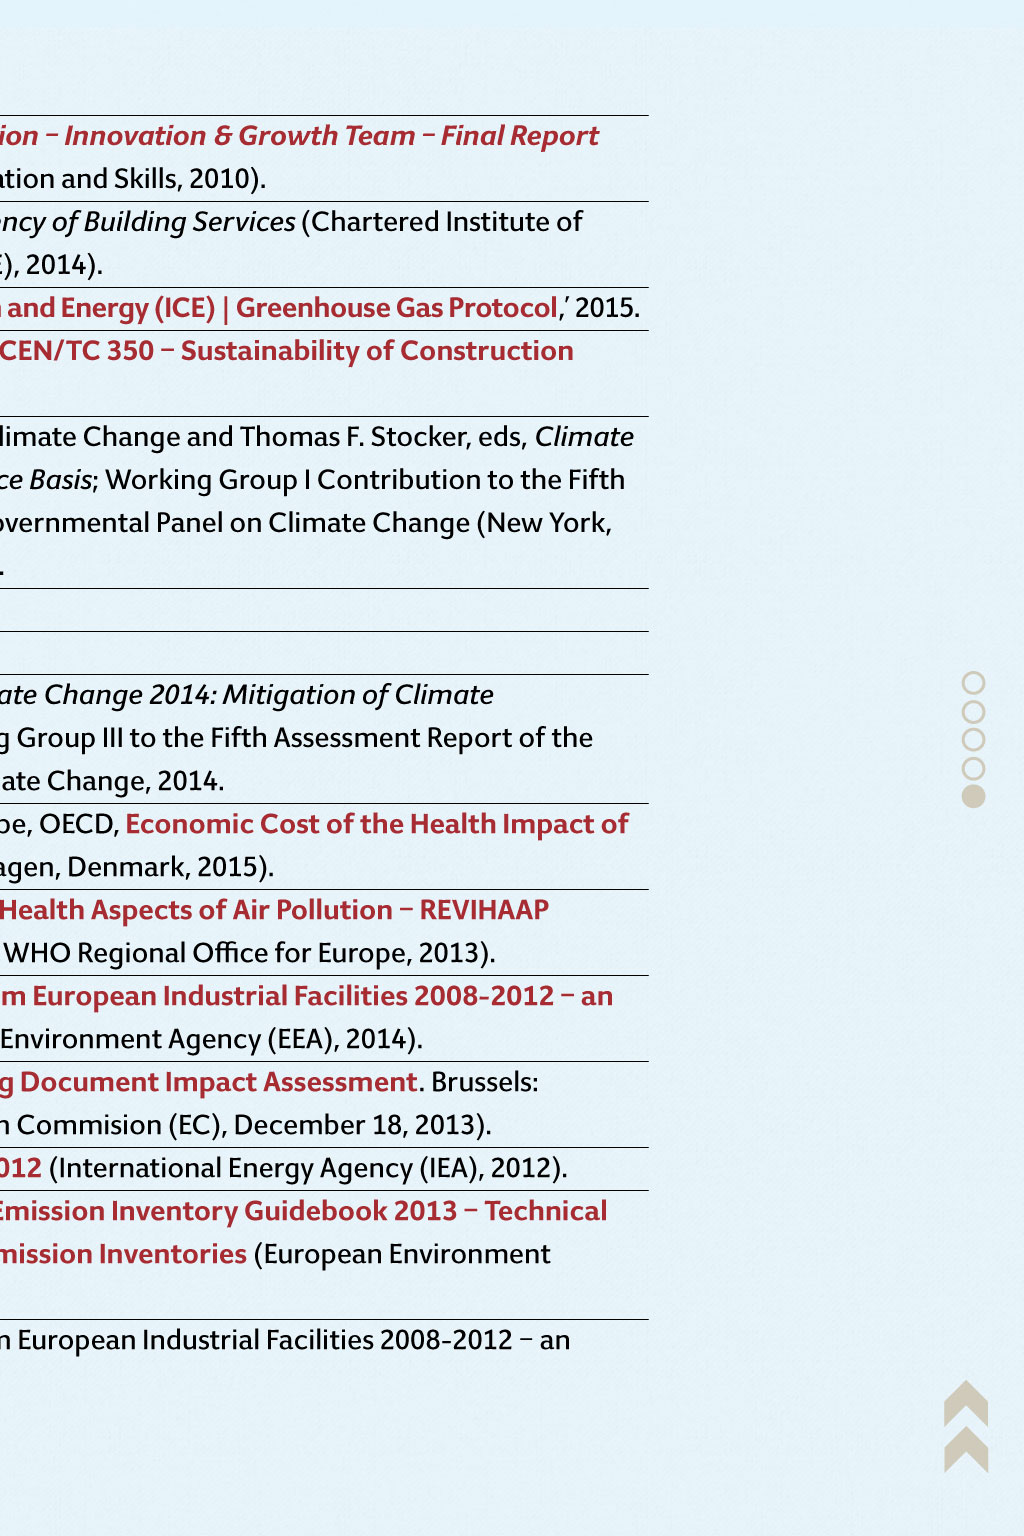
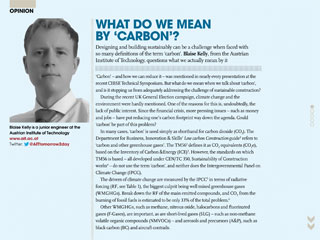
oPinion WhAt Do We MeAn By cARBon? Designing and building sustainably can be a challenge when faced with so many definitions of the term carbon. Blaise Kelly, from the Austrian Institute of Technology, questions what we actually mean by it Blaise Kelly is a junior engineer at the Austrian Institute of Technology www.ait.ac.at @ Aittomorrow2day Twitter: emitted compound Best estimate % +rF effect CO2 41.9 CH4 24.2 A&P BC 16.0 SLG CO 5.7 WMGHG Halocarbons 4.5 N20 4.2 SLG NMVOC 2.5 WMGHG HFCs PFCs SF6 0.7 A&P Aircraft Contrails 0.2 WMGHG table 1 radiative forcing (rF) effect of the main anthropogenic drivers of climate change7 Since the financial crisis, more pressing issues have put reducing ones carbon footprint way down the agenda Carbon and how we can reduce it was mentioned in nearly every presentation at the recent CIBSE Technical Symposium. But what do we mean when we talk about carbon, and is it stopping us from adequately addressing the challenge of sustainable construction? During the recent UK General Election campaign, climate change and the environment were hardly mentioned. One of the reasons for this is, undoubtedly, the lack of public interest. Since the financial crisis, more pressing issues such as money and jobs have put reducing ones carbon footprint way down the agenda. Could carbon be part of this problem? In many cases, carbon is used simply as shorthand for carbon dioxide (CO2). The Department for Business, Innovation & Skills Low carbon Construction guide1 refers to carbon and other greenhouse gases. The TM562 defines it as CO2 equivalents (CO2e), based on the Inventory of Carbon &Energy (ICE)3. However, the standards on which TM56 is based all developed under CEN/TC 350, Sustainability of Construction works4 do not use the term carbon, and neither does the Intergovernmental Panel on Climate Change (IPCC). The drivers of climate change are measured by the IPCC5 in terms of radiative forcing (RF, see Table 1), the biggest culprit being well mixed greenhouse gases (WMGHGs). Break down the RF of the main emitted compounds, and CO2 from the burning of fossil fuels is estimated to be only 33% of the total problem.6 Other WMGHGs, such as methane, nitrous oxide, halocarbons and fluorinated gases (F-Gases), are important, as are short-lived gases (SLG) such as non-methane volatile organic compounds (NMVOCs) and aerosols and precursors (A&P), such as black carbon (BC) and aircraft contrails. Globally, in 2010, buildings accounted for 33% of BC and F-Gas emissions, 32% of total energy use and 19% of WMGHG emissions.8 We can measure the energy used to manufacture materials and to construct a building, and the amount consumed by a building during its operation. We cannot measure CO2 or any other emissions, but we can convert this measured energy data based on experiments which were mainly carried out by the US Environmental Protection Agency in 1998. To give results/expectations of projects in terms of CO2e and/or carbon implies a level of accuracy that does not exist, misses off the raw data (energy) and can be incredibly confusing. The estimation of embodied energy, itself a non-trivial task, is described in TM56. This is made more complex by referring to it as embodied carbon. Describing building materials using embodied carbon also risks confusion with sequestered carbon, which is the process of storing CO2 taken out of the atmosphere by crops such as straw, wood, hemp and cork and using it in construction. Indeed, every construction material contains carbon. If we are measuring building performance in terms of energy, why convert it? If we do convert it to emissions estimates, the outputs can be used to express benefits of projects that are relevant to real life and to the public, and not simply rounded down to CO2e or carbon. is carbon only climate change? A recent World Health Organization report estimated that, every year, air pollution is responsible for the premature deaths of approximately 600,000 people and costs the EU 1.1tn. Of this, around 60bn is footed by the UK taxpayer 4% of GDP.9 In terms of the effects of air pollution on human health, particulate matter (PM) is the biggest culprit. Recent studies have shown that the effects of PM2.5 have been significantly underestimated and aside from the obvious lung impacts are linked to a host of neurodevelopment and cognitive-function problems, particularly in children, as well as other chronic diseases, such as diabetes.10 BC is the strongest radiative absorbing component of PM. It is the third-biggest contributor to climate change (see Table 1) and with a lifespan of only days in the atmosphere curtailing its production will reap an almost instant negative RF effect. Using freely available data from the European Environment Agency, it is possible to estimate emissions from nearly all common combustion sources. So, for the UK, you can break down the external cost estimates associated with each pollutant generated from the 2010 UK electricity mix, expressing the adverse impacts on human health and the environment as a monetary value.11 This is summed up and converted as a cost per kWh. (See the list of 28 pollutants and their estimated costs in Table 2 below.) It is calculated that every kWh of electricity consumed has a 0.03 additional external cost, which we pay for, primarily, through our taxes and loss of quality of life. A recent European Commission report blames the misconceived rush to biomass for use in household fuel combustion as a significant contribution to air pollution12. Growing the wrong crops, creating monocultures and sourcing from distant, delicate ecosystems can have a negative effect on RF through methane (CH4) and nitrous oxide (N2O) emissions. These must be considered in detail when attempting to include them as carbon savings in sustainable projects. cJ annual total Pollutant estimated emissions Per kWh Costs Million eUr Costs eUr/Cent estimated emissions CO2 1153.958 221.19 g 0.3318 1844.75 tonne ND 5.23 mg ND N2O 754.73 tonne ND 2.15 mg ND NOx 91286.50 tonne 616.458 333.07 mg 0.2249 CO 147480.42 tonne ND 414.31 mg ND NMVOC 2115.39 tonne 5.202 6.11 mg 0.0015 SOx 321559.40 tonne 9049.646 908.97 mg 2.5581 NH3 2.59 tonne 0.048 0.01 mg 0.0000 TSP 6685.81 tonne ND 20.17 mg ND PM10 6126.01 tonne 298.661 18.49 mg 0.0902 PM2.5 4782.39 tonne 359.059 21.32 mg 0.1601 BC 2494.23 tonne ND 7.29 mg ND Pb 3250.05 kg 3.136 9.13 g 0.0009 Cd 385.68 kg 0.011 1.18 g 0.0000 Hg 652.50 kg 0.594 1.88 g 0.0002 As 3017.93 kg 1.062 9.58 g 0.0003 Cr 1926.14 kg 0.076 6.27 g 0.0000 Cu 3884.99 kg ND 11.69 g ND Ni 2176.81 kg 0.009 6.10 g 0.0000 Se 9045.63 kg ND 26.69 g ND Zn 38259.18 kg ND 111.03 g ND PCBs 1353.19 mg ND 3.80 pg ND PCDD 5056.70 mg 0.137 14.20 pg 0.0000 Benzo(a)pyrene 652.70 mg ND 1.83 ng ND Benzo(b)fluoranthene 15037.61 g ND 43.20 ng ND Benzo(k)fluoranthene 11896.46 g ND 33.78 ng ND Indeno(1,2,3-cd)pyrene 970.81 g ND 33.78 ng ND HCB 2745.75 g ND 2.74 ng ND Total eor RMadE tonne CH4 table 2 Pollutants and their associated cost excluding CO2 released from the Uk electricity mix. electricity mix data from iea,13 combined with the eeMa/eea emission inventories for energy industries14 and eea external costs of air pollution data.15 nD=no data 76930563.65 11488.06 Total radIaTIvE forcINg whaT MakEs up clIMaTE chaNgE? RefeReNCes: 1 DfBIS, Low Carbon Construction Innovation & Growth Team Final Report (Department for Business, Innovation and Skills, 2010). 2 CIBSE, TM56 Resource Efficiency of Building Services (Chartered Institute of Building Service Engineers (CIBSE), 2014). 3 ICE, Bath inventory of Carbon and energy (iCe) | Greenhouse Gas Protocol, 2015. 4 CEN, Cen technical Bodies Cen/tC 350 Sustainability of Construction Works, 2015. 5 Intergovernmental Panel on Climate Change and Thomas F. Stocker, eds, Climate Change 2013: The Physical Science Basis; Working Group I Contribution to the Fifth Assessment Report of the Intergovernmental Panel on Climate Change (New York, NY: Cambridge Univ. Press, 2014). 6 Ibid. 7 Ibid. 8 O Edenhofer, IPCC, 2014: Climate Change 2014: Mitigation of Climate Change. Contribution of Working Group III to the Fifth Assessment Report of the Intergovernmental Panel on Climate Change, 2014. 9 WHO Regional Office for Europe, OECD, economic Cost of the Health impact of air Pollution in europe (Copenhagen, Denmark, 2015). 10 WHO, review of evidence on Health aspects of air Pollution reViHaaP Project (Copenhagen, Denmark: WHO Regional Office for Europe, 2013). 11 EEA, Costs of air Pollution from european industrial Facilities 2008-2012 an Updated assessment (European Environment Agency (EEA), 2014). 12 EC, Commision Staff Working Document impact assessment. Brussels: European Commission (European Commision (EC), December 18, 2013). 13 IEA, electricity information 2012 (International Energy Agency (IEA), 2012). 14 EEA, eMeP/eea air Pollutant emission inventory Guidebook 2013 technical Guidance to Prepare national emission inventories (European Environment Agency (EEA), 2013). 15 EEA, Costs of Air Pollution from European Industrial Facilities 2008-2012 an Updated Assessment. radIaTIvE forcINg whaT MakEs up clIMaTE chaNgE? Carbon dioxide (CO2) is the dominant greenhouse gas responsible for 42% of total RF onthe bestestimate scale. Of this, around 20% (8.6% of total) is not from fossil fuels, but from the burning of and loss of forest for sourcing of building materials and the creation of agricultural land, in some cases to grow biofuels. Anthropogenic sources of methane (CH4) account for around 65% of the global emissions since 2000. This includes rice paddies, agriculture, ruminant animals, sewage and waste, landfills and fossil-fuel extraction. Three main anthropogenic sources of nitrous oxide (N2O) are the Haber-Bosch process (the industrial procedure for producing ammonia), thecultivation of legumes and crops increasing biological nitrogen fixation (BNF), and the combustion of fossil fuels, which converts atmospheric N2 into NOx and is redeposited on the earth. Halogenated species can be powerful greenhouse gases; those containing chlorine andbromine also deplete the stratospheric ozone and have been sharply reduced thanks to the Montreal Protocol and its amendments. However, the consumption and emission of hydrofluorocarbons (HFCs) is expected to increase substantially over the next few decades because of demand for air conditioning units and insulated foam products, mainly in developing countries (Velders et al, 2009). Tropospheric ozone (O3) is a short-lived trace gas with an average lifespan of a few weeks (23 days). It is produced by precursor gases such as CO, NMVOC and NOx. NMVOC are emitted from industry, paint application, road transport, dry cleaning and other solvent uses. Benzene and 1,3-butadiene are directly hazardous to human health. Ozone is powerful and aggressive, reducing plants ability to photosynthesise and reproduce, and it stunts growth. In humans, it causes inflammation in the lungs and bronchia (EEA, 2013b). Aerosols (and cloud effects) consist of black carbon (BC), organic carbon and dust. BC gives a positive RF effect through its absorption of heat in the atmosphere and the dulling of white surfaces, such as the ice caps and glaciers. 3.37