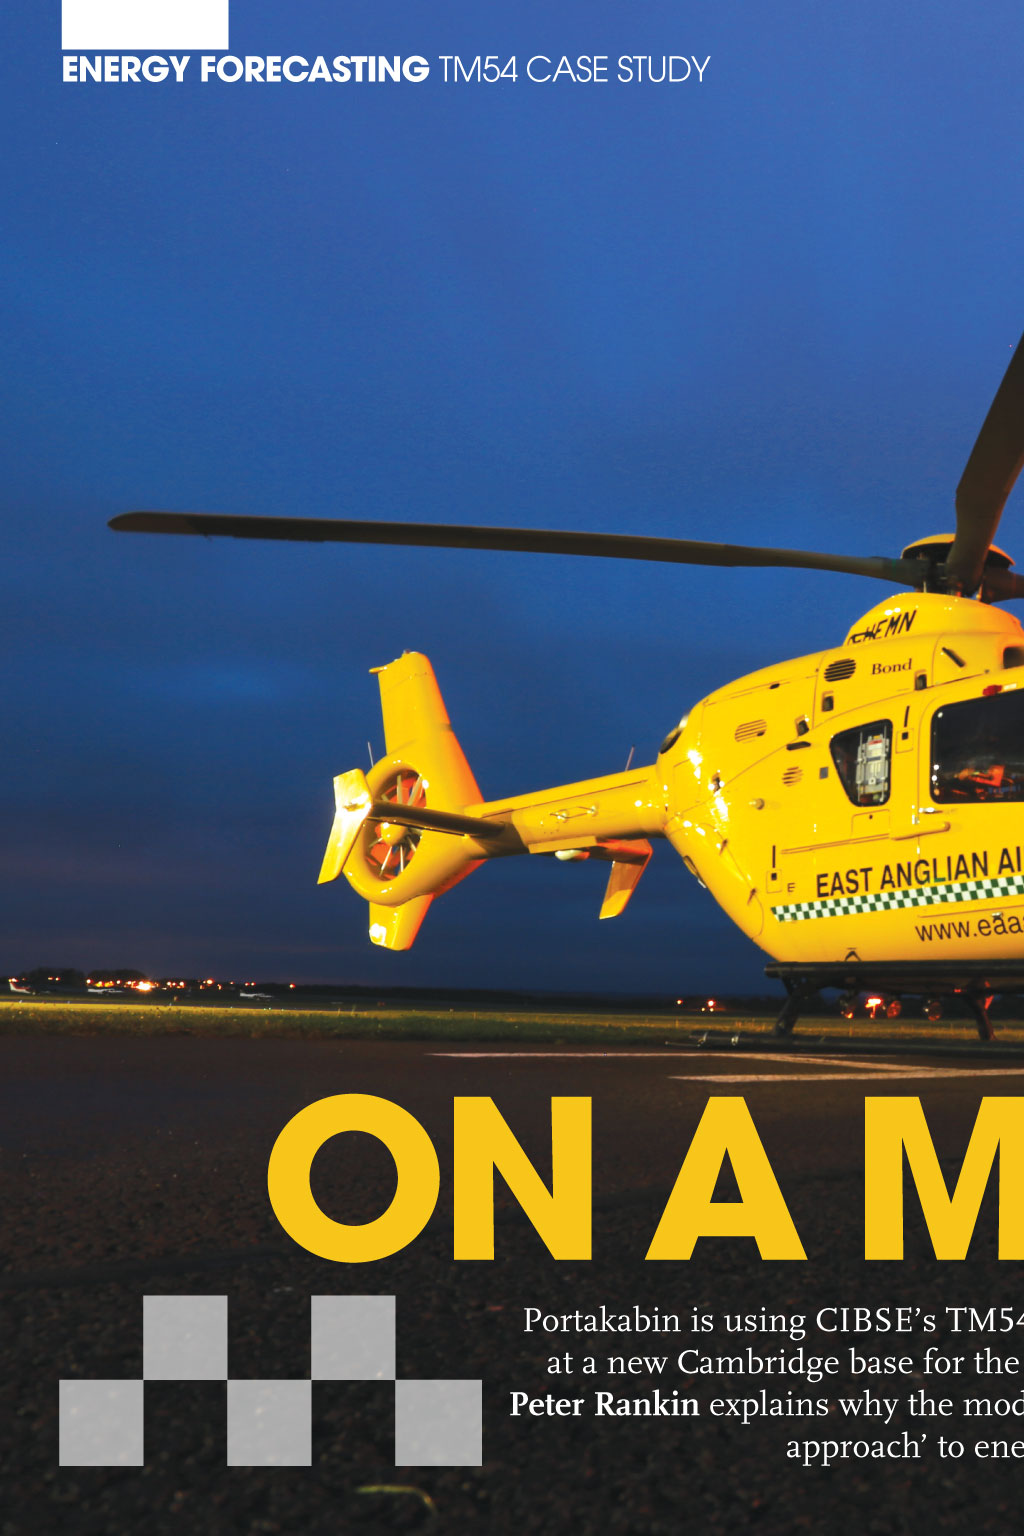
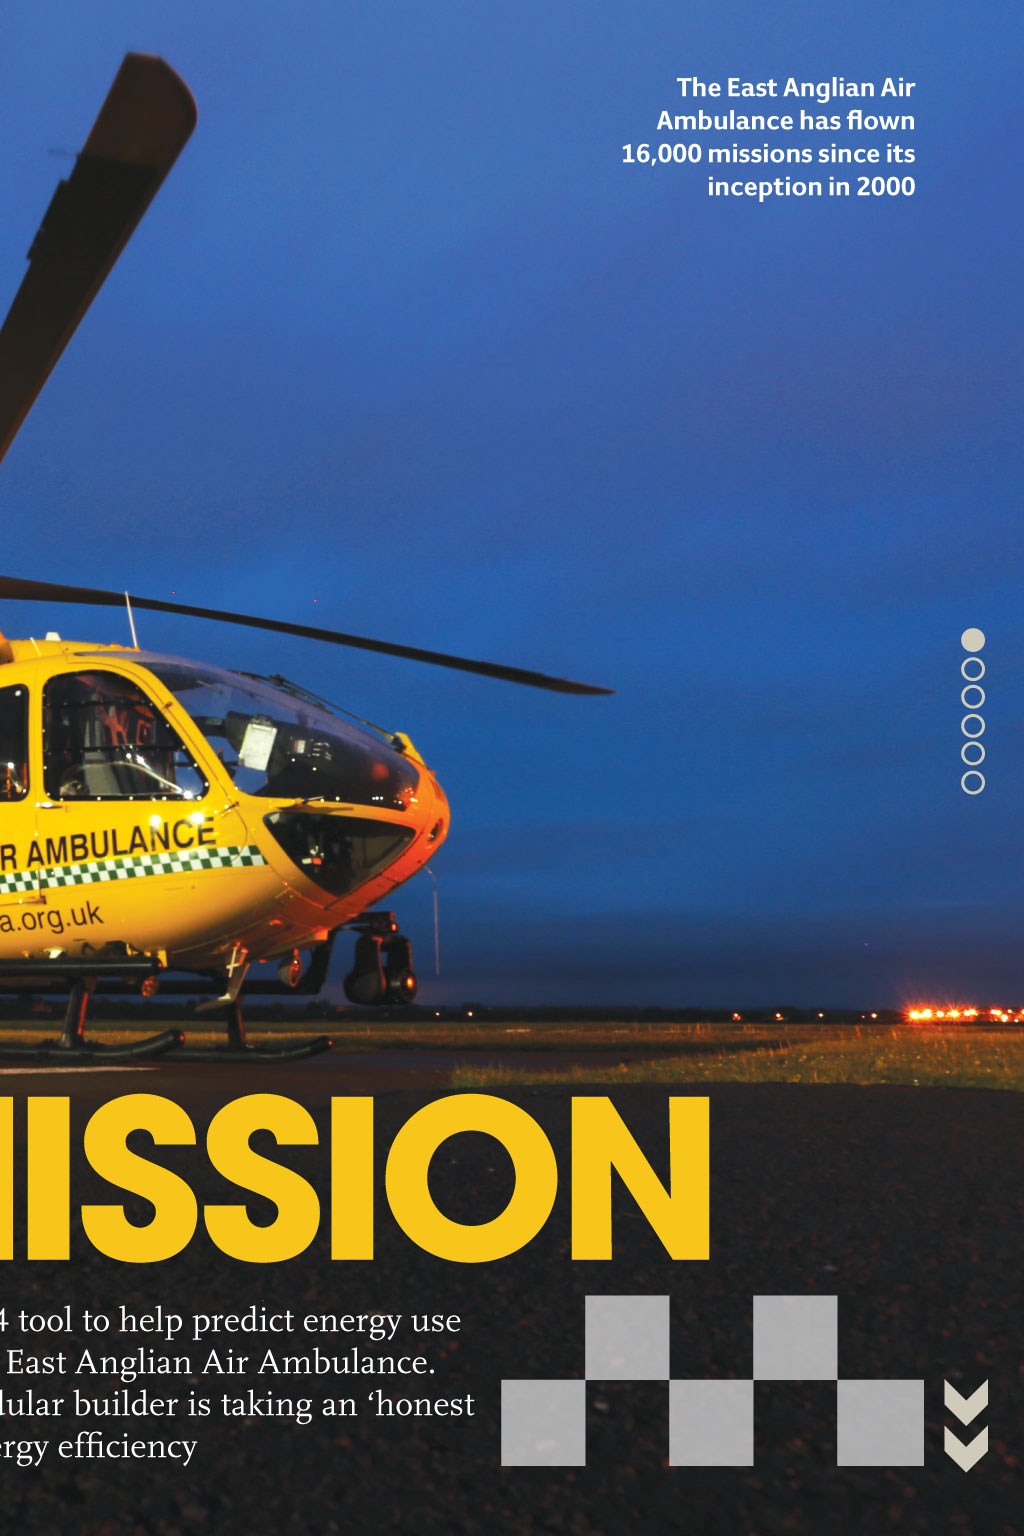
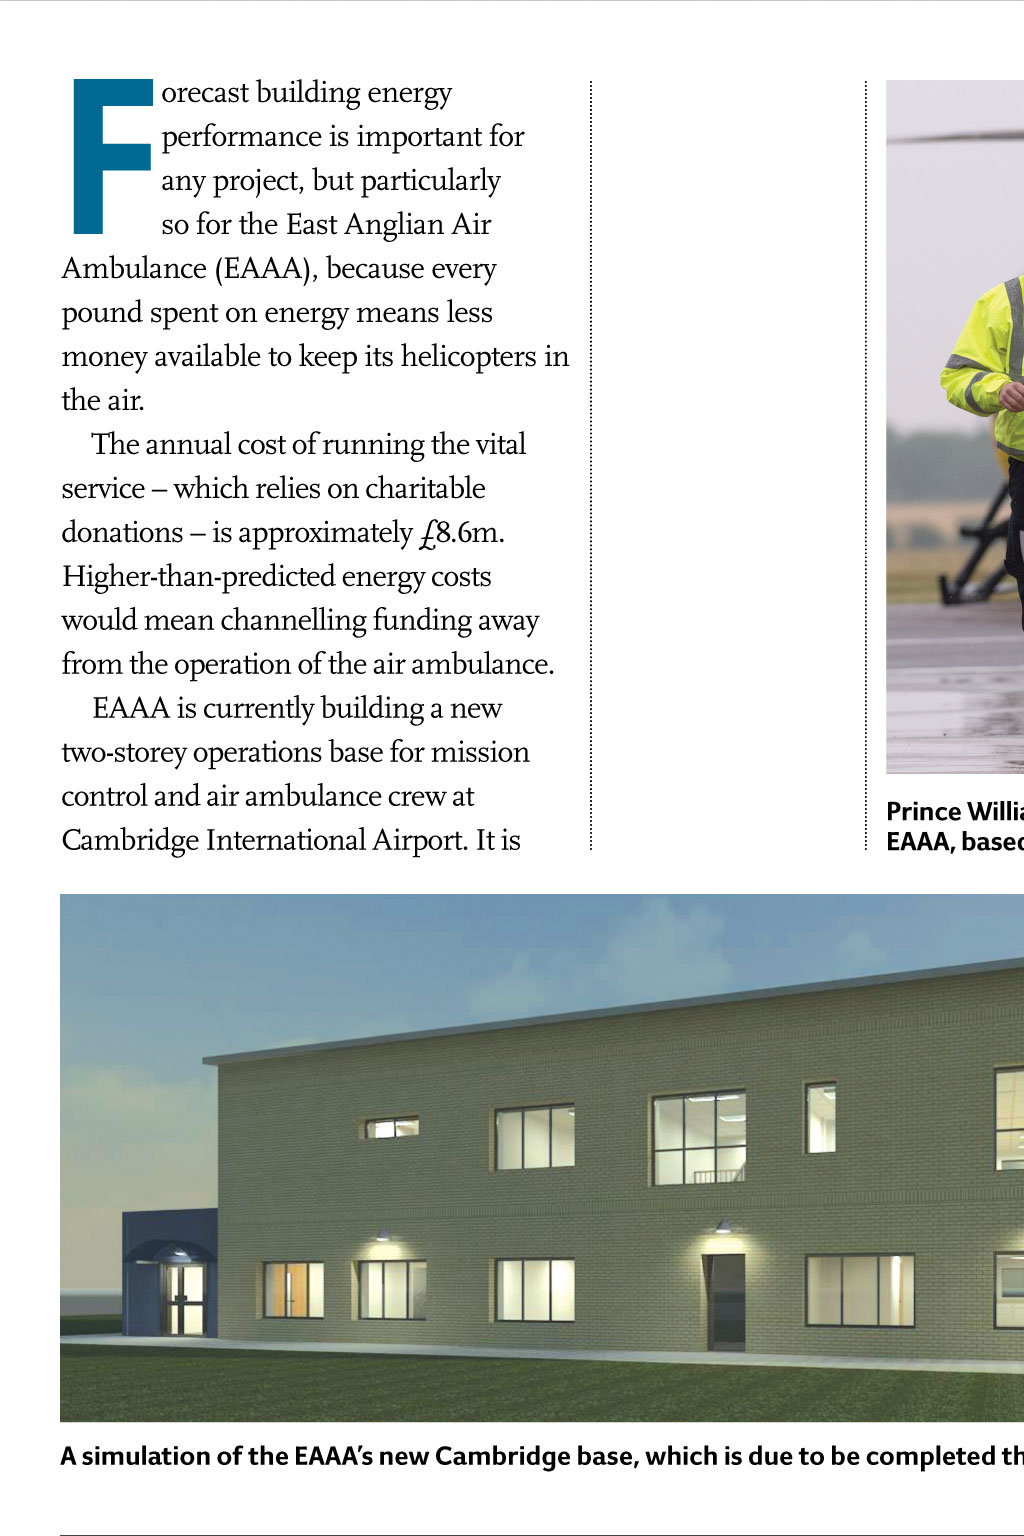
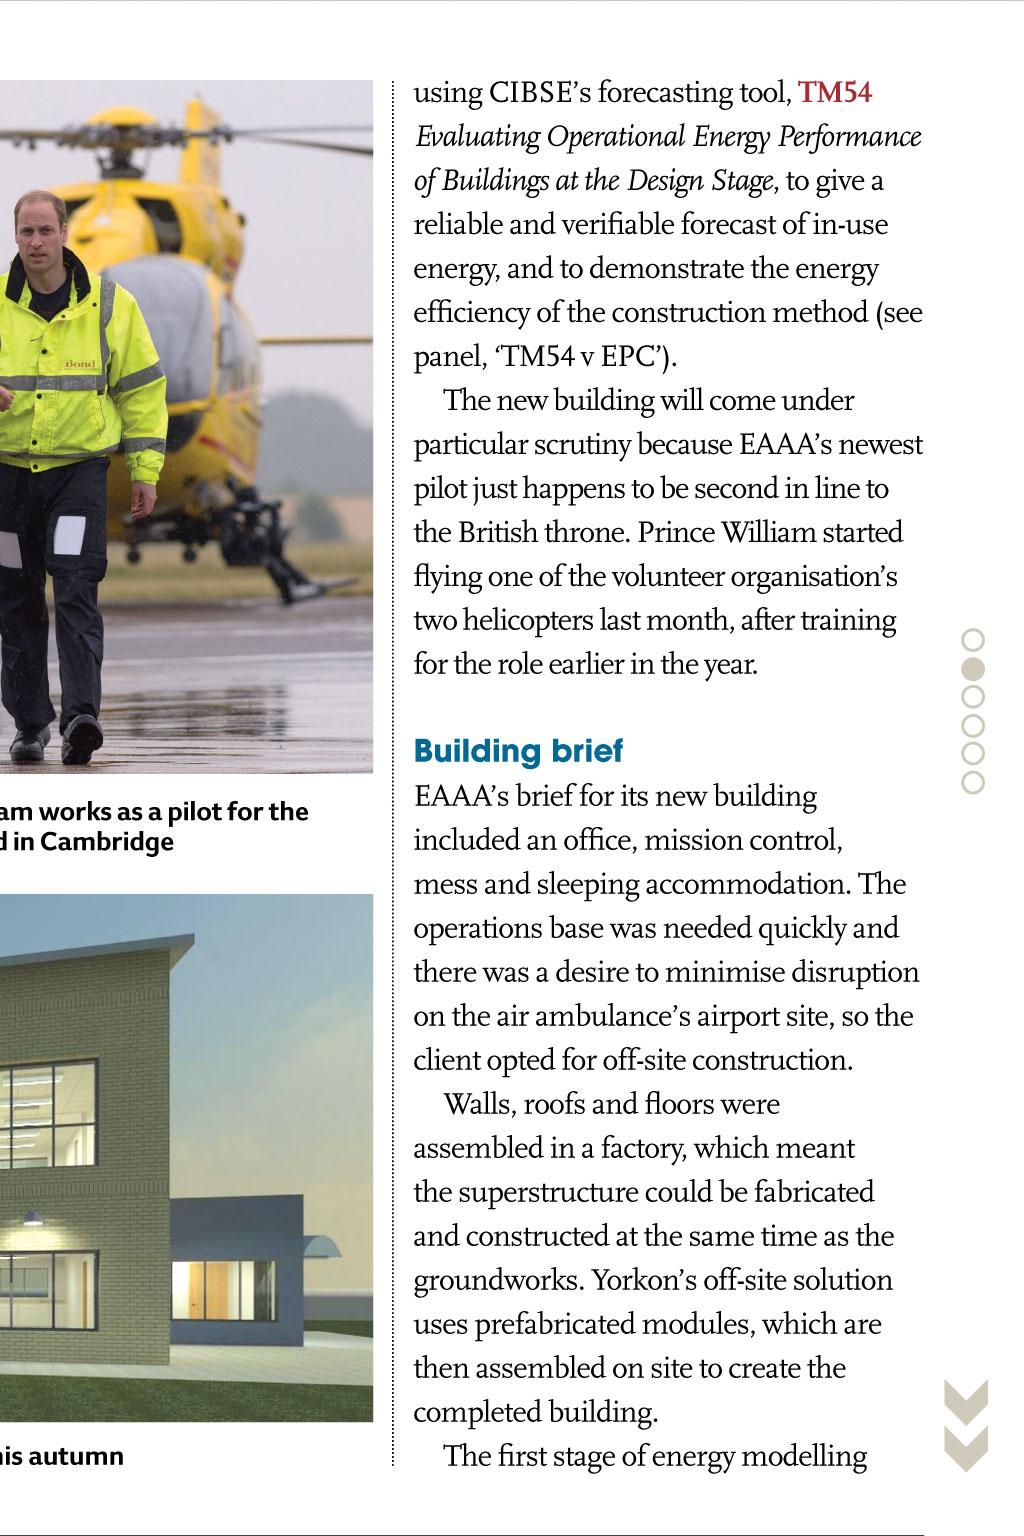

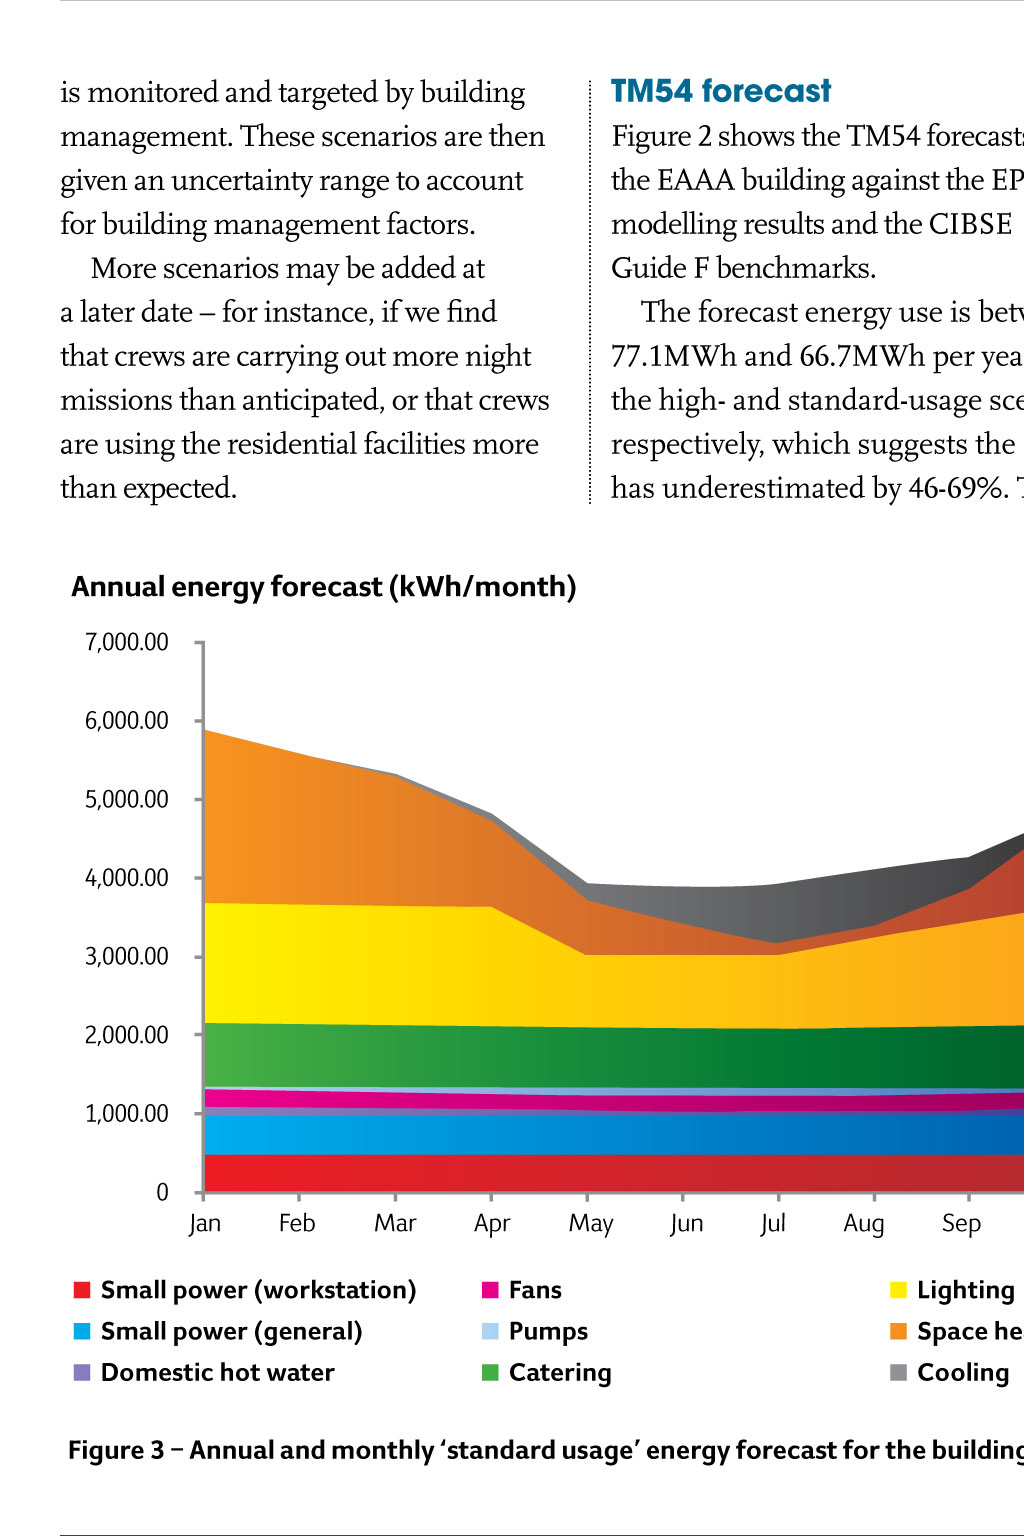
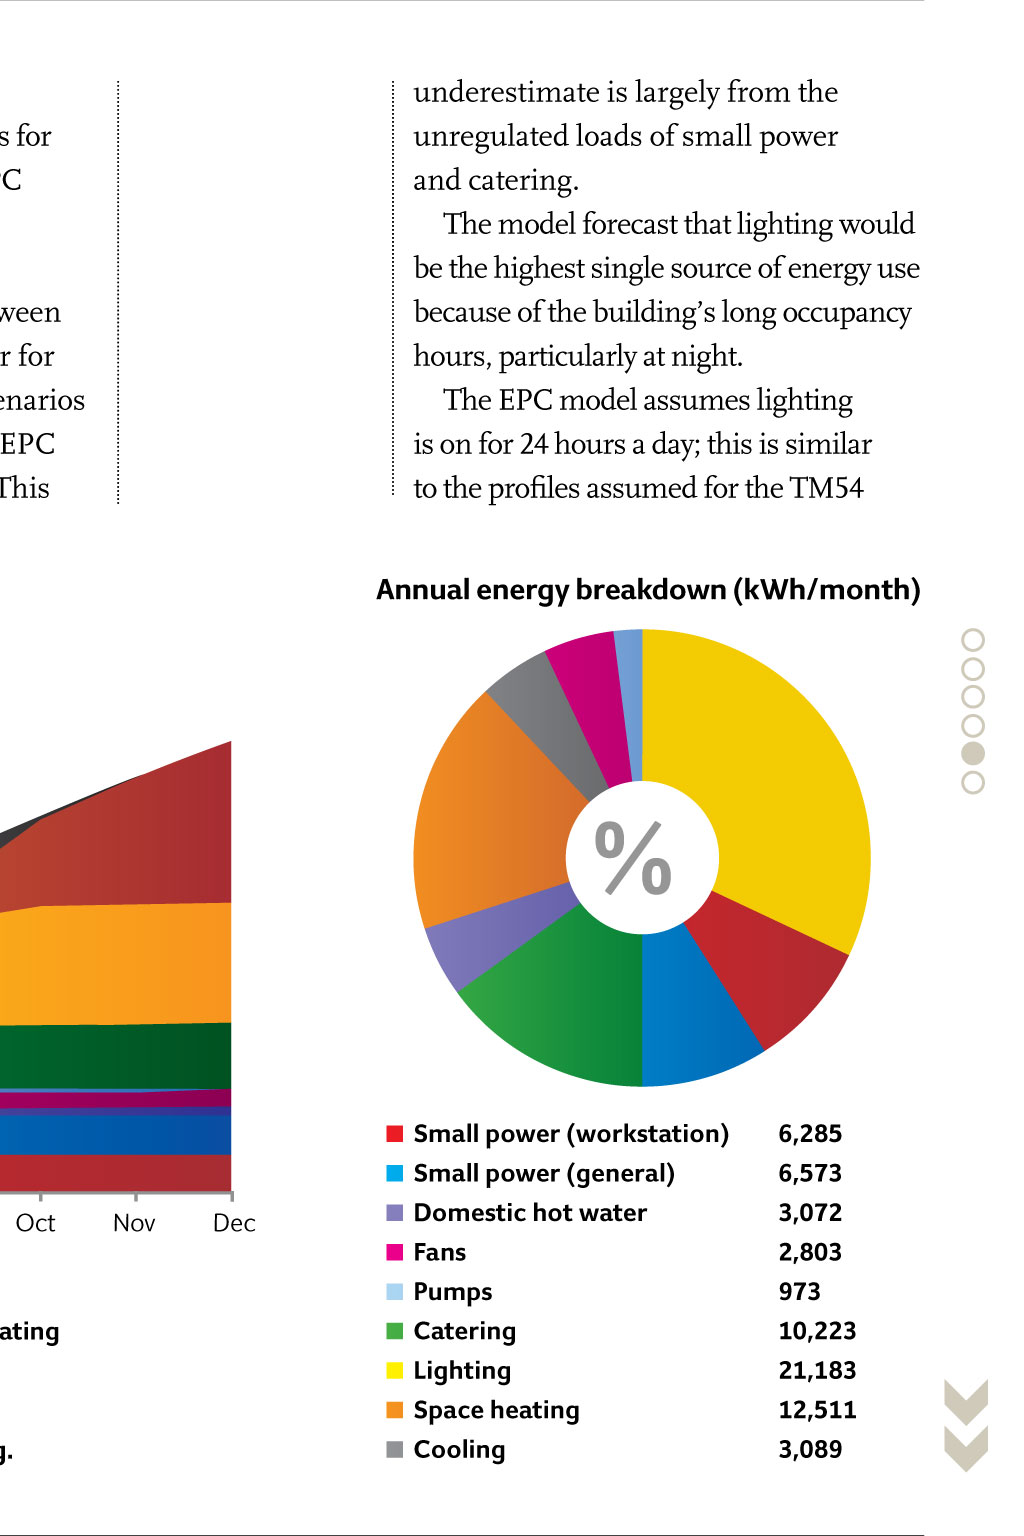
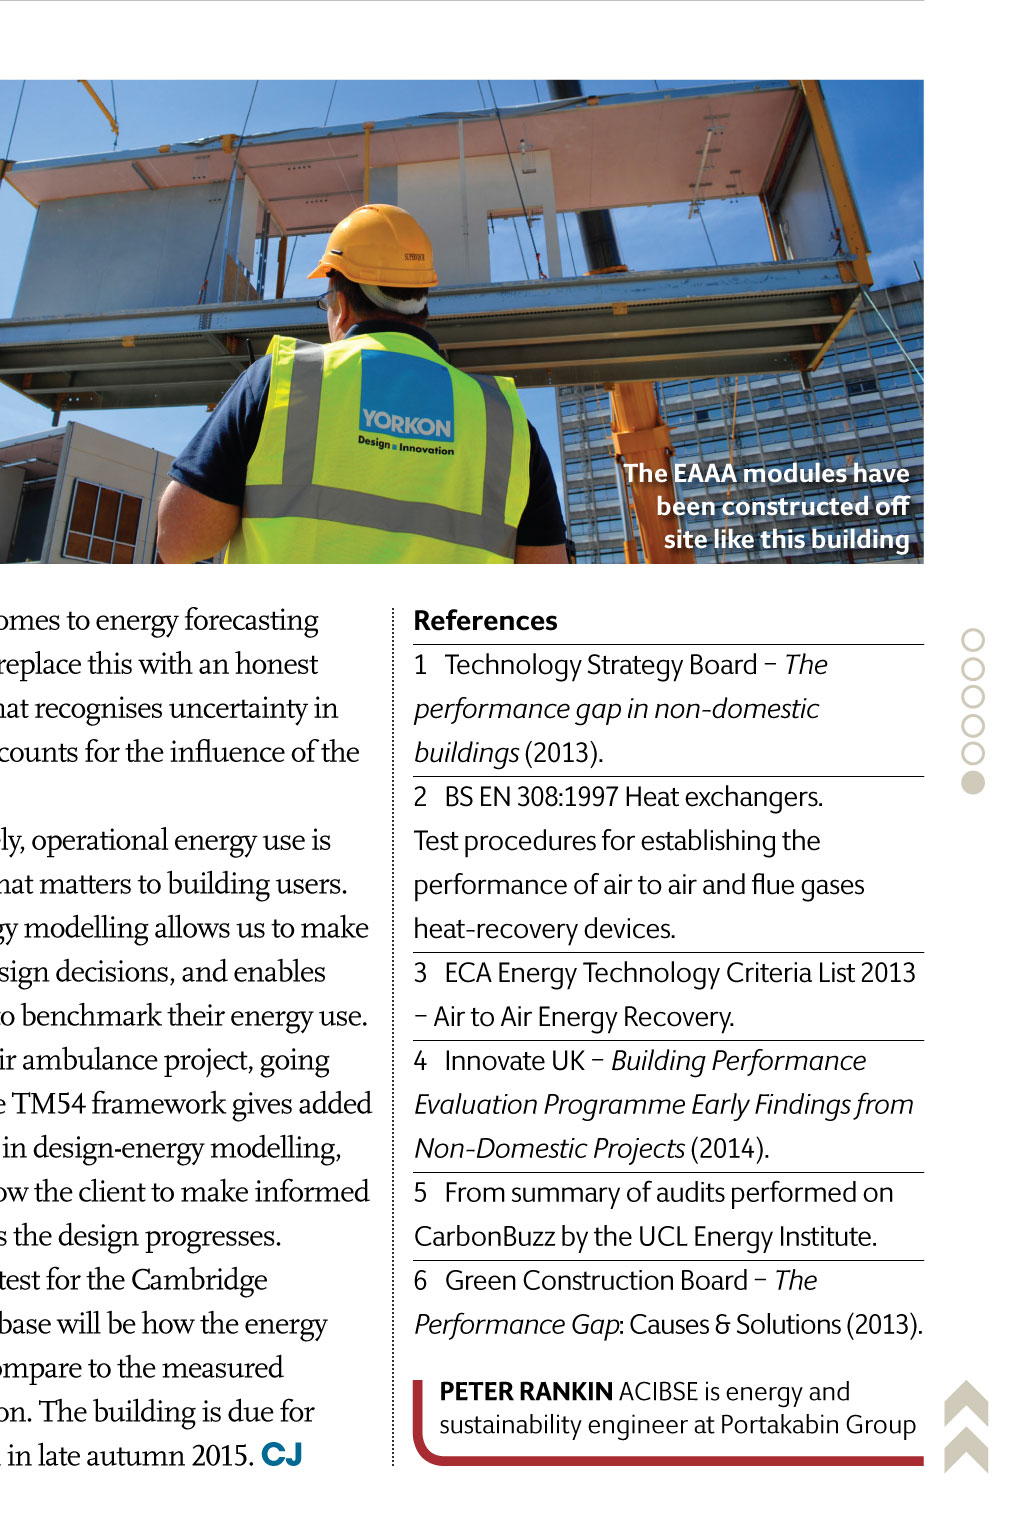
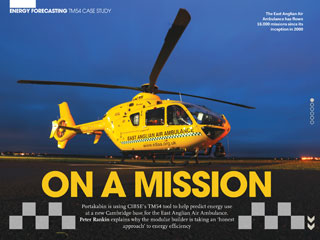
eneRgy foRecAsting XXXXXX XXXXXXXXX TM54 casE sTudy the east anglian air ambulance has flown 16,000 missions since its inception in 2000 on A Mission Portakabin is using CIBSEs TM54 tool to help predict energy use at a new Cambridge base for the East Anglian Air Ambulance. Peter Rankin explains why the modular builder is taking an honest approach to energy efficiency F using CIBSEs forecasting tool, TM54 Evaluating Operational Energy Performance of Buildings at the Design Stage, to give a reliable and verifiable forecast of in-use energy, and to demonstrate the energy efficiency of the construction method (see panel, TM54 v EPC). The new building will come under particular scrutiny because EAAAs newest pilot just happens to be second in line to the British throne. Prince William started flying one of the volunteer organisations two helicopters last month, after training for the role earlier in the year. orecast building energy performance is important for any project, but particularly so for the East Anglian Air Ambulance (EAAA), because every pound spent on energy means less money available to keep its helicopters in the air. The annual cost of running the vital service which relies on charitable donations is approximately 8.6m. Higher-than-predicted energy costs would mean channelling funding away from the operation of the air ambulance. EAAA is currently building a new two-storey operations base for mission control and air ambulance crew at Cambridge International Airport. It is Building brief EAAAs brief for its new building included an office, mission control, mess and sleeping accommodation. The operations base was needed quickly and there was a desire to minimise disruption on the air ambulances airport site, so the client opted for off-site construction. Walls, roofs and floors were assembled in a factory, which meant the superstructure could be fabricated and constructed at the same time as the groundworks. Yorkons off-site solution uses prefabricated modules, which are then assembled on site to create the completed building. The first stage of energy modelling Prince William works as a pilot for the eaaa, based in Cambridge a simulation of the eaaas new Cambridge base, which is due to be completed this autumn Figure 2 Building services design, including decentralised heat recovery units (HrUs), heatpump air-to-LtHW system and DX cooling is to establish occupancy patterns. The National Calculation Methodology (NCM) profiles used for Part L and EPCs were not too far off what is expected for the building; this is unusual, because the NCM tends to underestimate out of hours use.1 U-values of the building system are slightly better than the Part L notional building. One common problem with U-value calculations is the use of linear heat-loss calculations, which can be unrealistically optimistic, as they do not take account of repeat or intermediate thermal bridging. Fabric modelling for the project takes full account of thermal bridging, using 3D heat-flow modelling (see Figure 1). These calculations are also backed by third-party verification to the relevant British Standards. In temperature-critical areas of the building, reversible DX heat pumps are used. In other areas an air-to-LTHW heat pump system is specified; this also delivers hot water for showers and washbasins. Using the right efficiency figures eadE RMor choppEr facTs energy model comparison (kWh/annum) specified so that simultaneous heating and cooling of the same space cannot occur. (See Figure 2, building services design). Despite the best intentions of design, we must still account for the possibility that controls may not be used optimally. Giving building users control over heating and cooling systems can have its benefits, but can also increase energy consumption as users wrestle with controls for example, setting cooling to 16C on the misapprehension that this will cool the room more quickly. Small-power and catering energy use were taken from estimates of equipment power draw and its use. The TM54 document offers useful guidance and examples for how to estimate small power. Small power use in the building includes computers, server, and on-board specialist medical equipment, which the flight crew will recharge in the building. TM54 encourages the use of scenarios to present a range of forecast outcomes. At this early project stage, a standard practice forecast was created alongside a high-usage forecast. The scenarios assume that occupancy patterns are as expected, all equipment is well commissioned, maintained effectively and used appropriately, and that energy Guide F Benchmark ePC model tM54 highusage forecast tM54 standardusage forecast 0 20,000 40,000 60,000 80,000 100,000 120,000 Lighting Cooling Small power (workstation) Domestic hot water Fans Small power (general) Space heating Pumps Catering Figure 3 showing the tM54 forecasts against the ePC modelling results and the CiBSe Guide F benchmarks Nevertheless, modelling showed daylight to be beneficial in certain areas. Controls are often cited as a key reason for buildings not performing as designed.4 The studied building has a very simple system, with a central controller for the LTHW heating system, and local controls for direct expansion (DX) systems. Cooling systems are to be coupled with ventilation to make the best use of free cooling, and systems are It is natural for design teams to be optimistic about energy efficiency, but with forecasting, we must replace this with an honest approach that recognises uncertainty in data and accounts for the influence of the end-user tM54 forecast Figure 3 shows the TM54 forecasts for the EAAA building against the EPC modelling results and the CIBSE Guide F benchmarks. The forecast energy use is between 77.1MWh and 66.7MWh per year for the high- and standard-usage scenarios respectively, which suggests the EPC has underestimated by 46-69%. This is monitored and targeted by building management. These scenarios are then given an uncertainty range to account for building management factors. More scenarios may be added at a later date for instance, if we find that crews are carrying out more night missions than anticipated, or that crews are using the residential facilities more than expected. in the model for heating and cooling systems is important. The availability of seasonal coefficient of performance (COP) figures has, in theory, been a great step in narrowing the gap between design and performance. No longer can designers optimise their equipment for a single test condition. However, we must still treat seasonal COPs and energy efficiency ratios with caution, because the demand profile used for seasonal calculations will probably not match the reality, and may not take the defrost cycle into account. Another area in which we need to be careful about how we use manufacturers data is ventilation, which is delivered by decentralised heat-recovery air handling units. The manufacturer claims a 70% heat-recovery efficiency for the plate heat exchangers. Heat exchanger efficiencies are determined using set conditions2 for temperature, humidity, and airflow, all of which will vary in reality. At this stage, a more conservative 55% figure3 has been used in the energy model. Lighting is LED throughout, with absence control to occupied areas, and presence control elsewhere. Daylight in the building is limited because glazing areas are designed to reduce noise nuisance from the airport outside. underestimate is largely from the unregulated loads of small power and catering. The model forecast that lighting would be the highest single source of energy use because of the buildings long occupancy hours, particularly at night. The EPC model assumes lighting is on for 24 hours a day; this is similar to the profiles assumed for the TM54 32+9+155182p annual energy forecast (kWh/month) annual energy breakdown (kWh/month) 7,000.00 6,000.00 5,000.00 4,000.00 3,000.00 2,000.00 1,000.00 Small power (workstation) Small power (general) Jan Feb Mar Apr May Jun Jul Aug Sep Oct Nov 3,072 Fans Dec 6,573 Domestic hot water 0 6,285 2,803 Small power (workstation) Fans Lighting Pumps 973 Small power (general) Pumps Space heating Catering 10,223 Domestic hot water Catering Cooling Lighting 21,183 Space heating 12,511 Cooling 3,089 Figure 4 annual and monthly standard usage energy forecast for the building. forecast, but these may be revised for later scenarios. Choosing LEDs for efficiency and longevity has been validated by these results. This is one area in which different occupancy scenarios will have a big effect. Results suggest that the EPC model underestimated energy use for heating and cooling, because of restrictions in the EPC process when accounting for control inefficiencies, defrost cycles and in-use efficiency. Energy used for domestic hot water appears to have been overestimated in the EPC because of demand profiles assuming a far greater use of changing and shower facilities than predicted. There was some difficulty in finding appropriate benchmarks in CIBSE Guide F; the closest approximations for each energy use were mostly office buildings. It is nevertheless interesting that cooling and ventilation energy use are so much higher than the modelled results. Heating and DHW energy benchmarks should be taken with the knowledge that the Guide F standards are for fossil-fuel systems rather than heat pumps. the advantages of tM54 It is natural for design teams to be optimistic about energy efficiency, but the eaaa modules have been constructed off site like this building eadE RMor TM54 v Epcs when it comes to energy forecasting we must replace this with an honest approach that recognises uncertainty in data and accounts for the influence of the end user. Ultimately, operational energy use is the figure that matters to building users. Good energy modelling allows us to make effective design decisions, and enables occupants to benchmark their energy use. For the air ambulance project, going through the TM54 framework gives added confidence in design-energy modelling, and will allow the client to make informed decisions as the design progresses. The real test for the Cambridge operations base will be how the energy forecasts compare to the measured consumption. The building is due for completion in late autumn 2015. cJ choppEr facTs CIBSEs TM54: Evaluating Operational Energy Performance of Buildings at Design Stage sets out a framework in which to build models to forecast in-use energy. In most cases, this will involve modification of the Part L/EPC model using the same dynamic simulation software. The energy performance gap the difference between as-designed and as-built energy use is a hot topic among building professionals. Data from CarbonBuzz suggest that a typical office building will consume 59% more energy than its design target.5 The Green Construction Board suggests the performance gap could be closer to 200%.6 Much of the discussion has focused on commissioning, build quality and the influence of the end user. These are crucial to energy performance in operation, but one factor that is often misunderstood is energy modelling. Energy Performance Certificates (EPCs) are not designed to predict in-use energy 1 Technology Strategy Board The performance gap in non-domestic buildings (2013). 2 BS EN 308:1997 Heat exchangers. Test procedures for establishing the performance of air to air and flue gases heat-recovery devices. 3 ECA Energy Technology Criteria List 2013 Air to Air Energy Recovery. 4 Innovate UK Building Performance Evaluation Programme Early Findings from Non-Domestic Projects (2014). 5 From summary of audits performed on CarbonBuzz by the UCL Energy Institute. 6 Green Construction Board The Performance Gap: Causes & Solutions (2013). Peter rankin ACIBSE is energy and sustainability engineer at Portakabin Group TM54 v Epcs The EAAA is a charitable organisation covering Bedfordshire, Cambridgeshire, Norfolk and Suffolk. It employs critical-care paramedics, doctors, and support staff to work alongside helicopter pilots. Maintaining air ambulance operations for 365 days a year involves a number of costs, including aircraft maintenance, staff, accommodation, medical equipment and fuel. From 2013/14, the EAAA attended 1,730 missions an average of 4.7 per day 244 of which were night missions. Since its inception in 2000, the air ambulance has flown more than 16,000 missions. If you would like to find out more about the work of the East Anglian Air Ambulance, or wish to make a donation, visit www.eaaa.org.uk or callorE 669 999. M 08450 references Read performance. EPC and Part L modelling is designed, instead, to assess the theoretical energy and CO2 efficiency of a building in a method common to all buildings of its type. To make different buildings comparable, the EPC method must ignore actual operational profiles and variables such as small-power loads. Some fixed building services such as lifts, escalators, security systems, and emergency lighting are also ignored. This rigidity means assessors cannot use their judgement to make realistic and conservative adjustments to standard inputs, or to allow for how occupants will use the building. A lack of reliable energy data at design stage not only means disappointment at the as-built stage, but also hampers our ability to make well-informed design decisions. Percentage CO2 savings targets from renewables are a good example of where as-measured results may be well below design targets.