
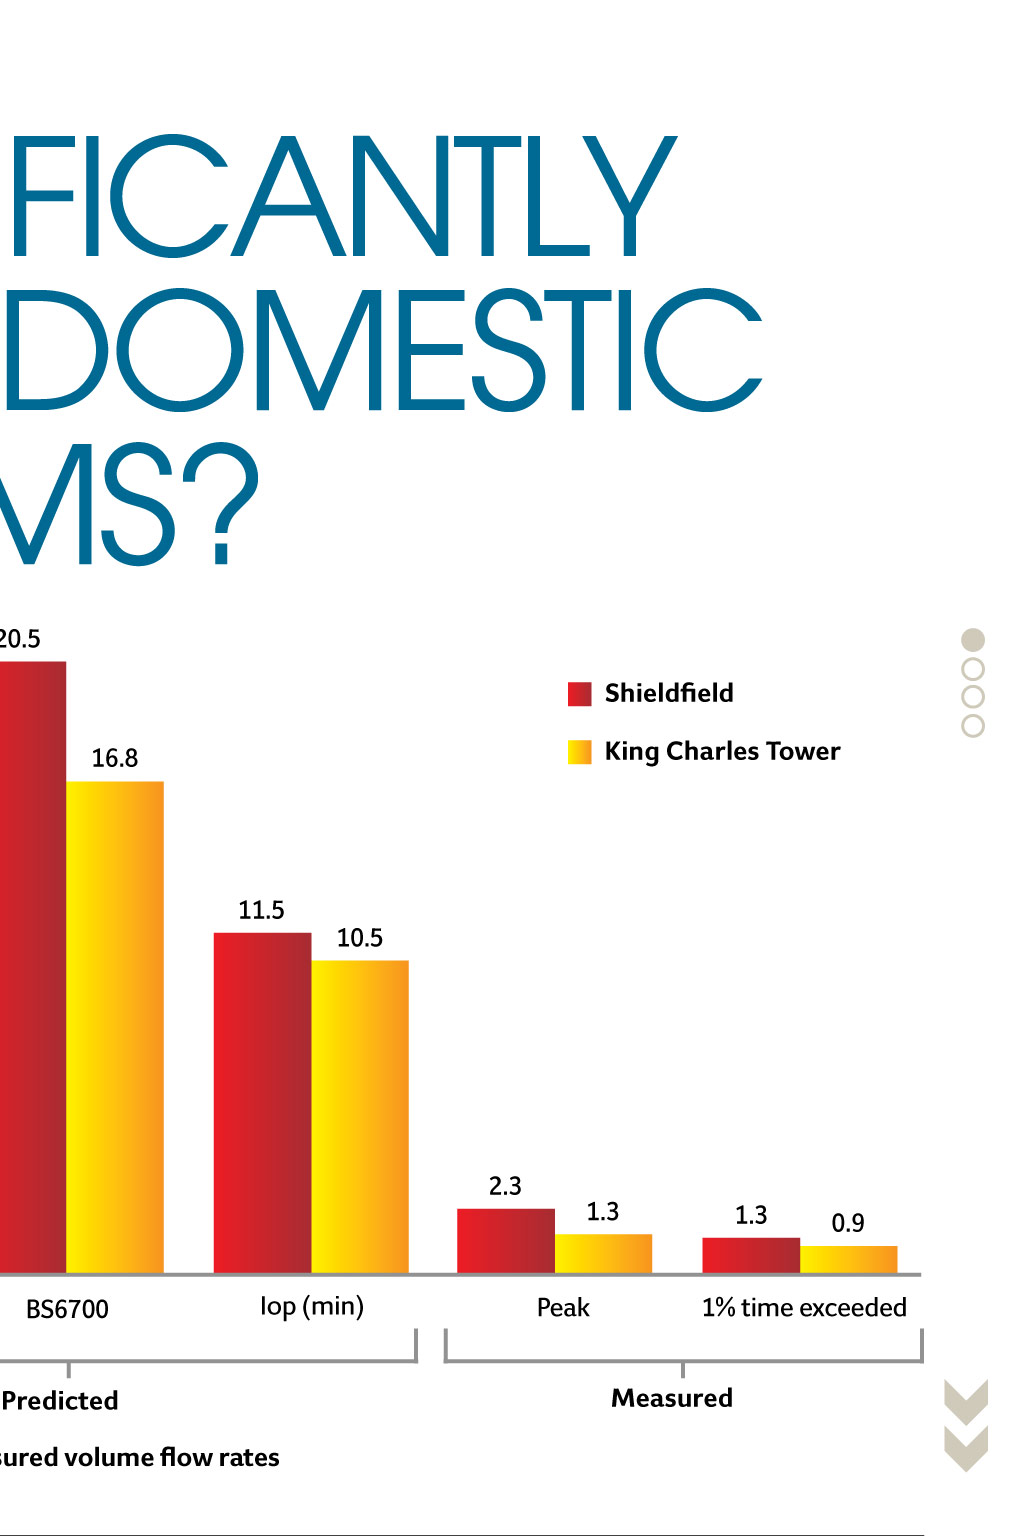

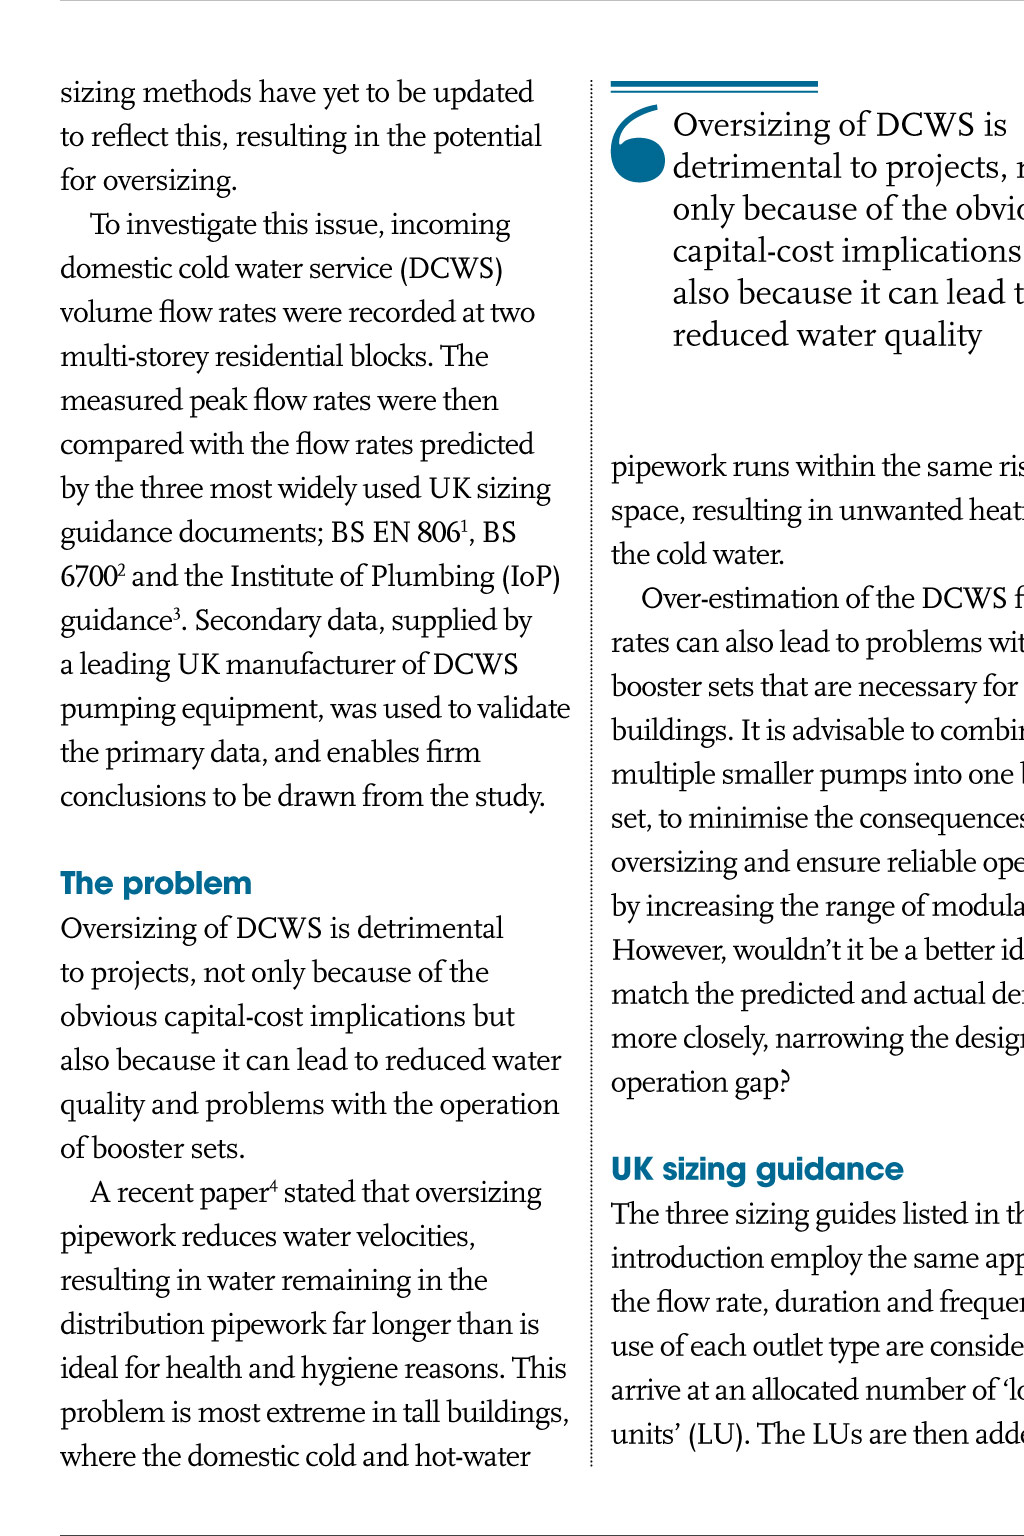
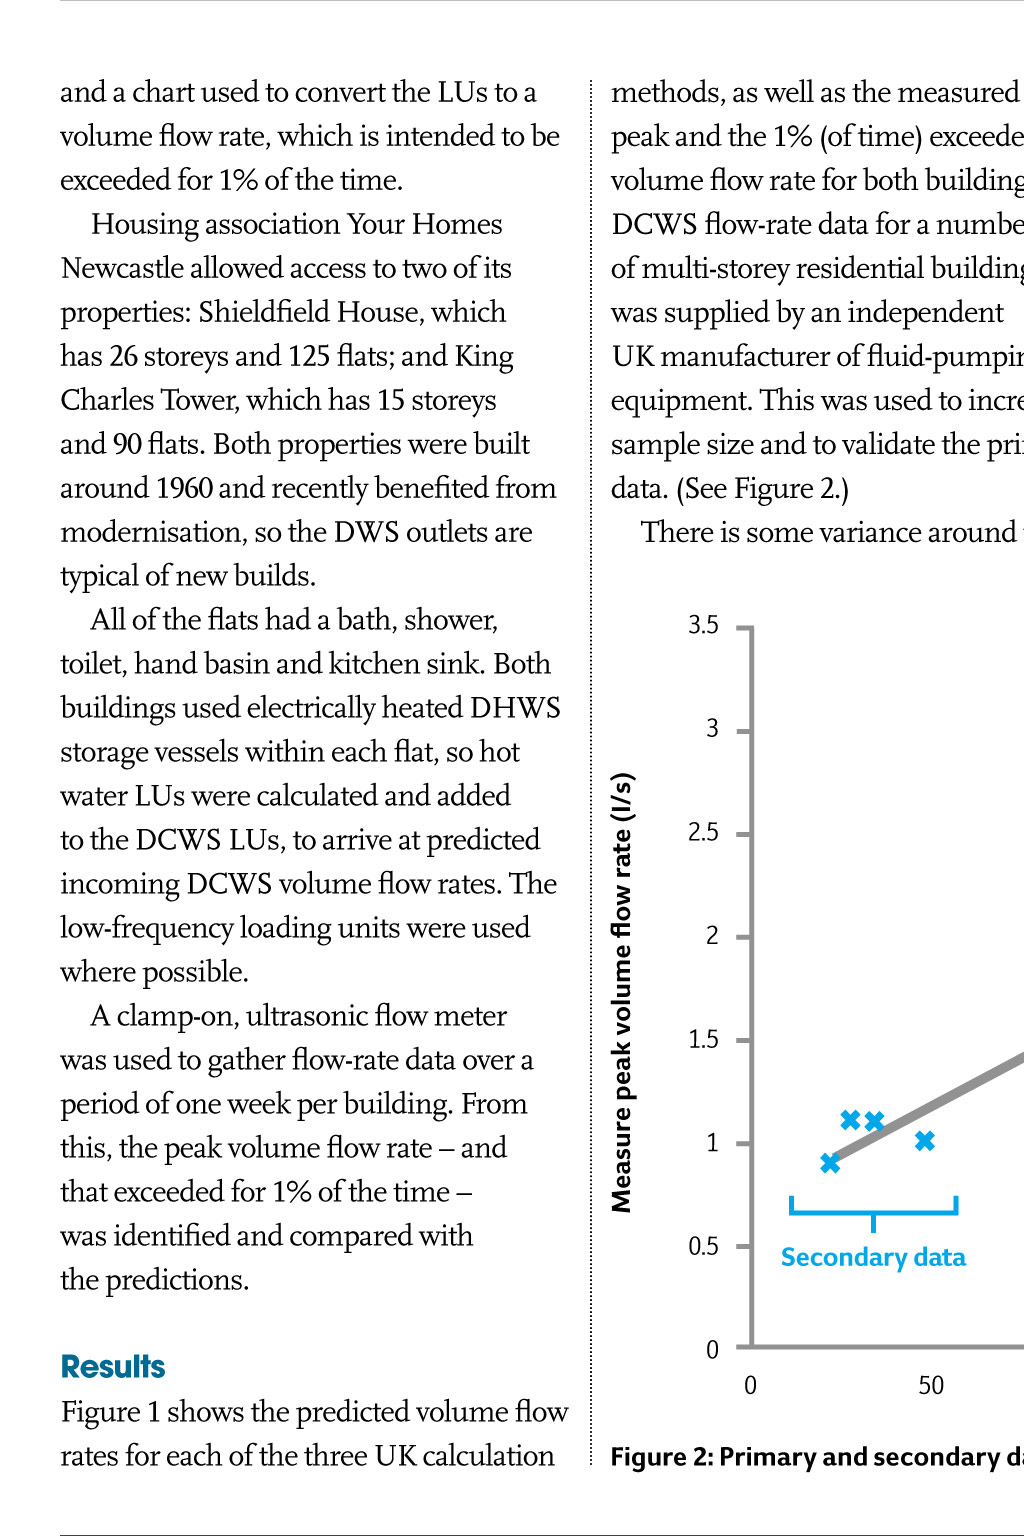


Domestic Water Systems Oversizing Are We Significantly Oversizing Domestic Water Systems? 20.5 A focus on saving water is pushing down domestic water volume flow rates, but UK sizing methods have yet to reflect this change, say Jess Tindall and Jamie Pendle results Figure 1 shows the predicted volume flow rates for each of the three UK calculation almost parallel to that for the measured data (see Figure 3), so it results in less error for large projects. The IoP and BS 6700 methods both show that the margin of error increases in proportion to the size of the development. There is a significant margin between the predicted and measured peak flow rates a greater margin still if the 1% time exceeded is taken into account so engineers should use BS EN 806 for similar projects. The IoP method led to more than double the oversizing compared to the use of BS EN 806, while the predictions of BS 6700 were many times the required value so very significantly oversized. These findings should be welcome news for architectural and building services engineers as we aim to narrow the design to operation gap. cJ A poster of this article will be presented at the CIBSE 2015 Technical Symposium on 16-17 April, at UCL London. More information here. JESS TINDALL is a senior lecturer at the faculty of engineering and environment, Northumbria University JAMIE PENDLE is a graduate mechanical engineer at Arup Volume flow rate (I/s) 10.5 10 5.7 5 4.8 2.3 0 BS EN 806 Iop (min) BS6700 1.3 Peak 1.3 0.9 1% time exceeded Measured Predicted Figure 1: Design predicted vs measured volume flow rates Shieldfield House Oversizing of DCWS is detrimental to projects, not only because of the obvious capital-cost implications but also because it can lead to reduced water quality pipework runs within the same riser space, resulting in unwanted heating of the cold water. Over-estimation of the DCWS flow rates can also lead to problems with the booster sets that are necessary for tall buildings. It is advisable to combine multiple smaller pumps into one booster set, to minimise the consequences of oversizing and ensure reliable operation by increasing the range of modulation. However, wouldnt it be a better idea to match the predicted and actual demand more closely, narrowing the design to operation gap? Uk sizing guidance The three sizing guides listed in the introduction employ the same approach: the flow rate, duration and frequency of use of each outlet type are considered to arrive at an allocated number of loading units (LU). The LUs are then added up line of best fit, as expected, given the different sizes of flat and number and type of outlets. However, there is a clear correlation between the primary and secondary data. methods, as well as the measured peak and the 1% (of time) exceeded volume flow rate for both buildings. DCWS flow-rate data for a number of multi-storey residential buildings was supplied by an independent UK manufacturer of fluid-pumping equipment. This was used to increase the sample size and to validate the primary data. (See Figure 2.) There is some variance around the Findings It is evident that BS EN 806 predicts volume flow rates closer than the two other methods for all buildings in the study. Additionally, the line of best fit is 3.5 3 Primary data 2.5 R2 = 0.8387 2 1.5 Secondary data 1 0.5 Secondary data 0 0 50 100 150 200 250 300 Figure 2: Primary and secondary data measured peak volume flow rates REFERENCES: within buildingsand their curtilages 1 British Standards Institution, BS Specification. London, BSI, 2006. EN 806-3:2006, Specifications 3 The Institute of Plumbing. Plumbing for installations inside buildings Engineering Services Design Guide. conveying water for human Hornchurch, The Institute of consumption. London, BSI, 2006. Plumbing, 2002. 2 British Standards Institution, BS 4 Agudelo-Vera C, Scheffer W, Pieterse- 6700:2006, Design, installation, Quirijns I, Blokker M. New Method testing and maintenance of services to Design Domestic Water Systems, supplying water for domestic use REHVA Journal, December 2013, p12-16. 30 Shieldfield House and a chart used to convert the LUs to a volume flow rate, which is intended to be exceeded for 1% of the time. Housing association Your Homes Newcastle allowed access to two of its properties: Shieldfield House, which has 26 storeys and 125 flats; and King Charles Tower, which has 15 storeys and 90 flats. Both properties were built around 1960 and recently benefited from modernisation, so the DWS outlets are typical of new builds. All of the flats had a bath, shower, toilet, hand basin and kitchen sink. Both buildings used electrically heated DHWS storage vessels within each flat, so hot water LUs were calculated and added to the DCWS LUs, to arrive at predicted incoming DCWS volume flow rates. The low-frequency loading units were used where possible. A clamp-on, ultrasonic flow meter was used to gather flow-rate data over a period of one week per building. From this, the peak volume flow rate and that exceeded for 1% of the time was identified and compared with the predictions. 11.5 King Charles Tower The problem Oversizing of DCWS is detrimental to projects, not only because of the obvious capital-cost implications but also because it can lead to reduced water quality and problems with the operation of booster sets. A recent paper4 stated that oversizing pipework reduces water velocities, resulting in water remaining in the distribution pipework far longer than is ideal for health and hygiene reasons. This problem is most extreme in tall buildings, where the domestic cold and hot-water King Charles Tower 15 Measure peak volume flow rate (I/s) sizing methods have yet to be updated to reflect this, resulting in the potential for oversizing. To investigate this issue, incoming domestic cold water service (DCWS) volume flow rates were recorded at two multi-storey residential blocks. The measured peak flow rates were then compared with the flow rates predicted by the three most widely used UK sizing guidance documents; BS EN 8061, BS 67002 and the Institute of Plumbing (IoP) guidance3. Secondary data, supplied by a leading UK manufacturer of DCWS pumping equipment, was used to validate the primary data, and enables firm conclusions to be drawn from the study. Shieldfield 16.8 Peak/design volume flow rate (I/s) O ver recent decades, a growing awareness of the need to reduce water and energy consumption has led to significant changes in the amount of water used. For example, manufacturers of washing machines are now obliged to show the waterconsumption data for their products so that buyers can choose efficient models if they wish. Consequently, peak domestic water volume flow rates are likely to have reduced; however, UK 20 25 20 BS6700 IoP (Min) 15 10 BS EN 806 5 Measured data 0 0 50 100 150 200 250 Number of flats Figure 3: Design flow rates predicted for the nine buildings, alongside the measured peak volume flow rates